
Bitcoin saw a surge of ~$500 today, a surge that contributed to the price shooting up from $6,600 to $7,100. This caused liquidations of shorts worth $27 million. Soon after this, the price retraced from $7,100 to $6,900, triggering liquidations of longs worth $21 million. As Bitcoin receives its weekly dose of volatility, it is time to know where BTC is headed and what this move might mean.
Bitcoin 4-hour chart
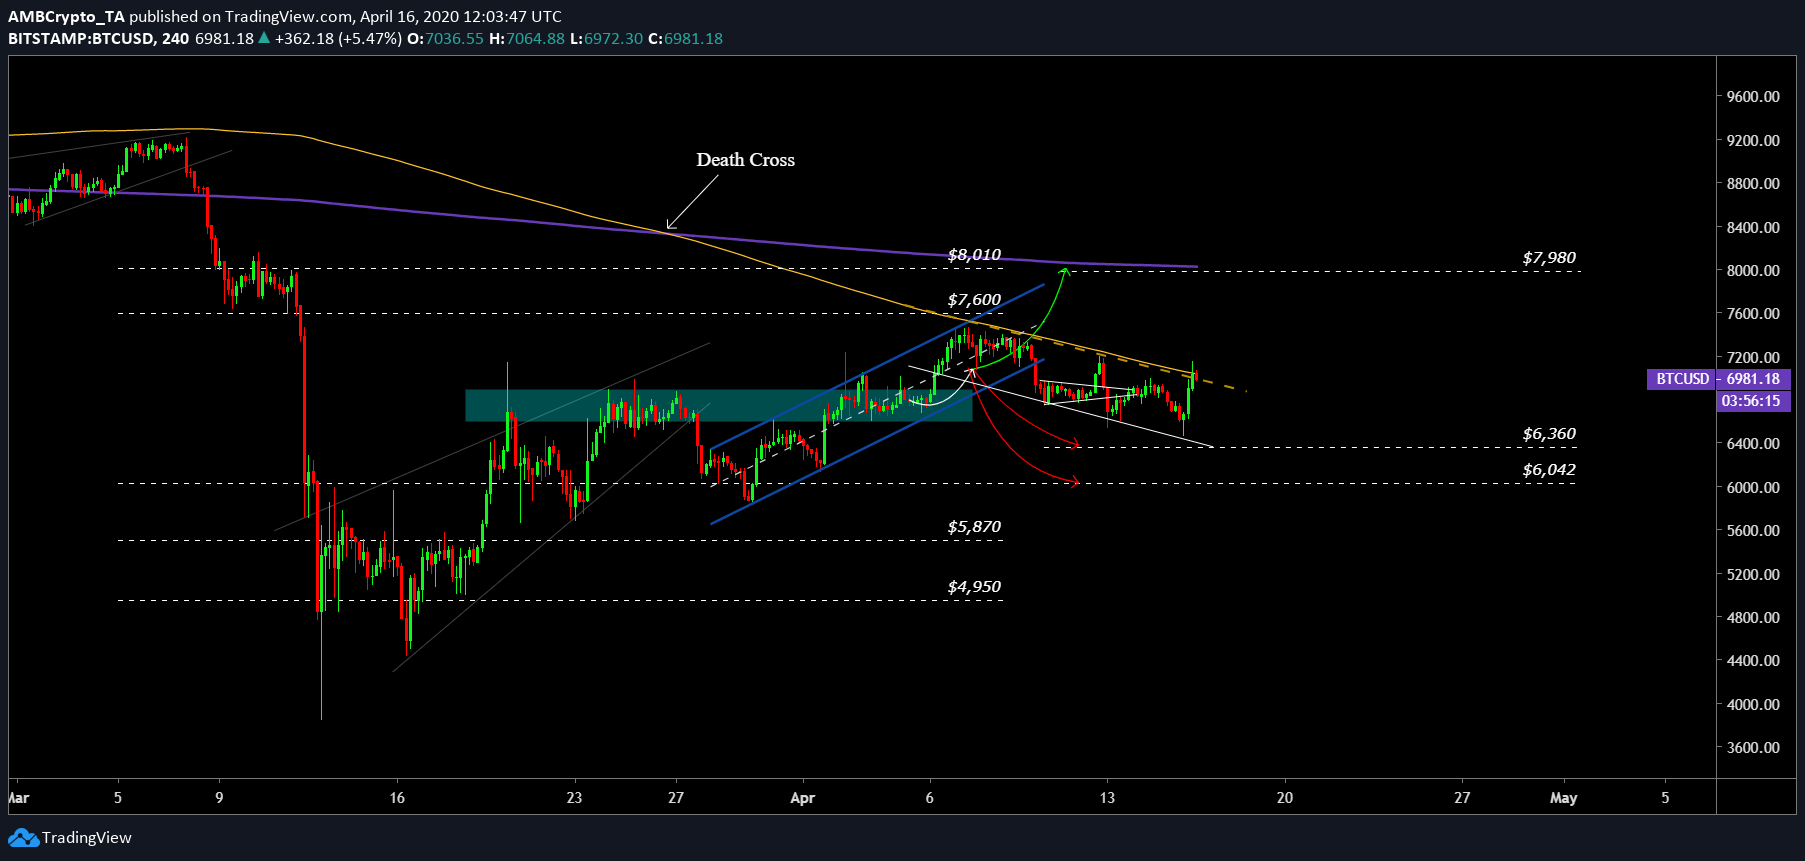
Source: BTCUSD TradingView
The four-hour chart for Bitcoin showed that the breakout of the rising wedge did go into the $6,400 zone as mentioned previously; however, it was only for a brief moment. As seen on the chart, the price was riding in the descending parallel channel, at the time of writing.
The channel showed a dotted yellow line, which is the extension of the 50-day moving average [DMA]. This has been a major point of resistance for the price until today’s pump; however, considering the retracement the price is undergoing, it looks like it might be resistance in the near future as well.
Depending on the daily close today, the price might either climb higher or dig deeper and perhaps revisit the $6,400 zone. However, if it decides to do the former, then the daily close of BTC must generally be above $7,200 to see more bullish momentum.
The bullish scenario looks more rewarding considering the upside it has to offer. After $7,300 or even $7,400, the price has little or a total resistance-free zone up to $8,500 [with the exception of the 200DMA at $8,000].
The RSI has been hovering around the 50-mark [aka a neutral zone] and saw a bounce higher with the recent surge, and this came with no bearish divergences on the horizon.
Bitcoin’s Weekly
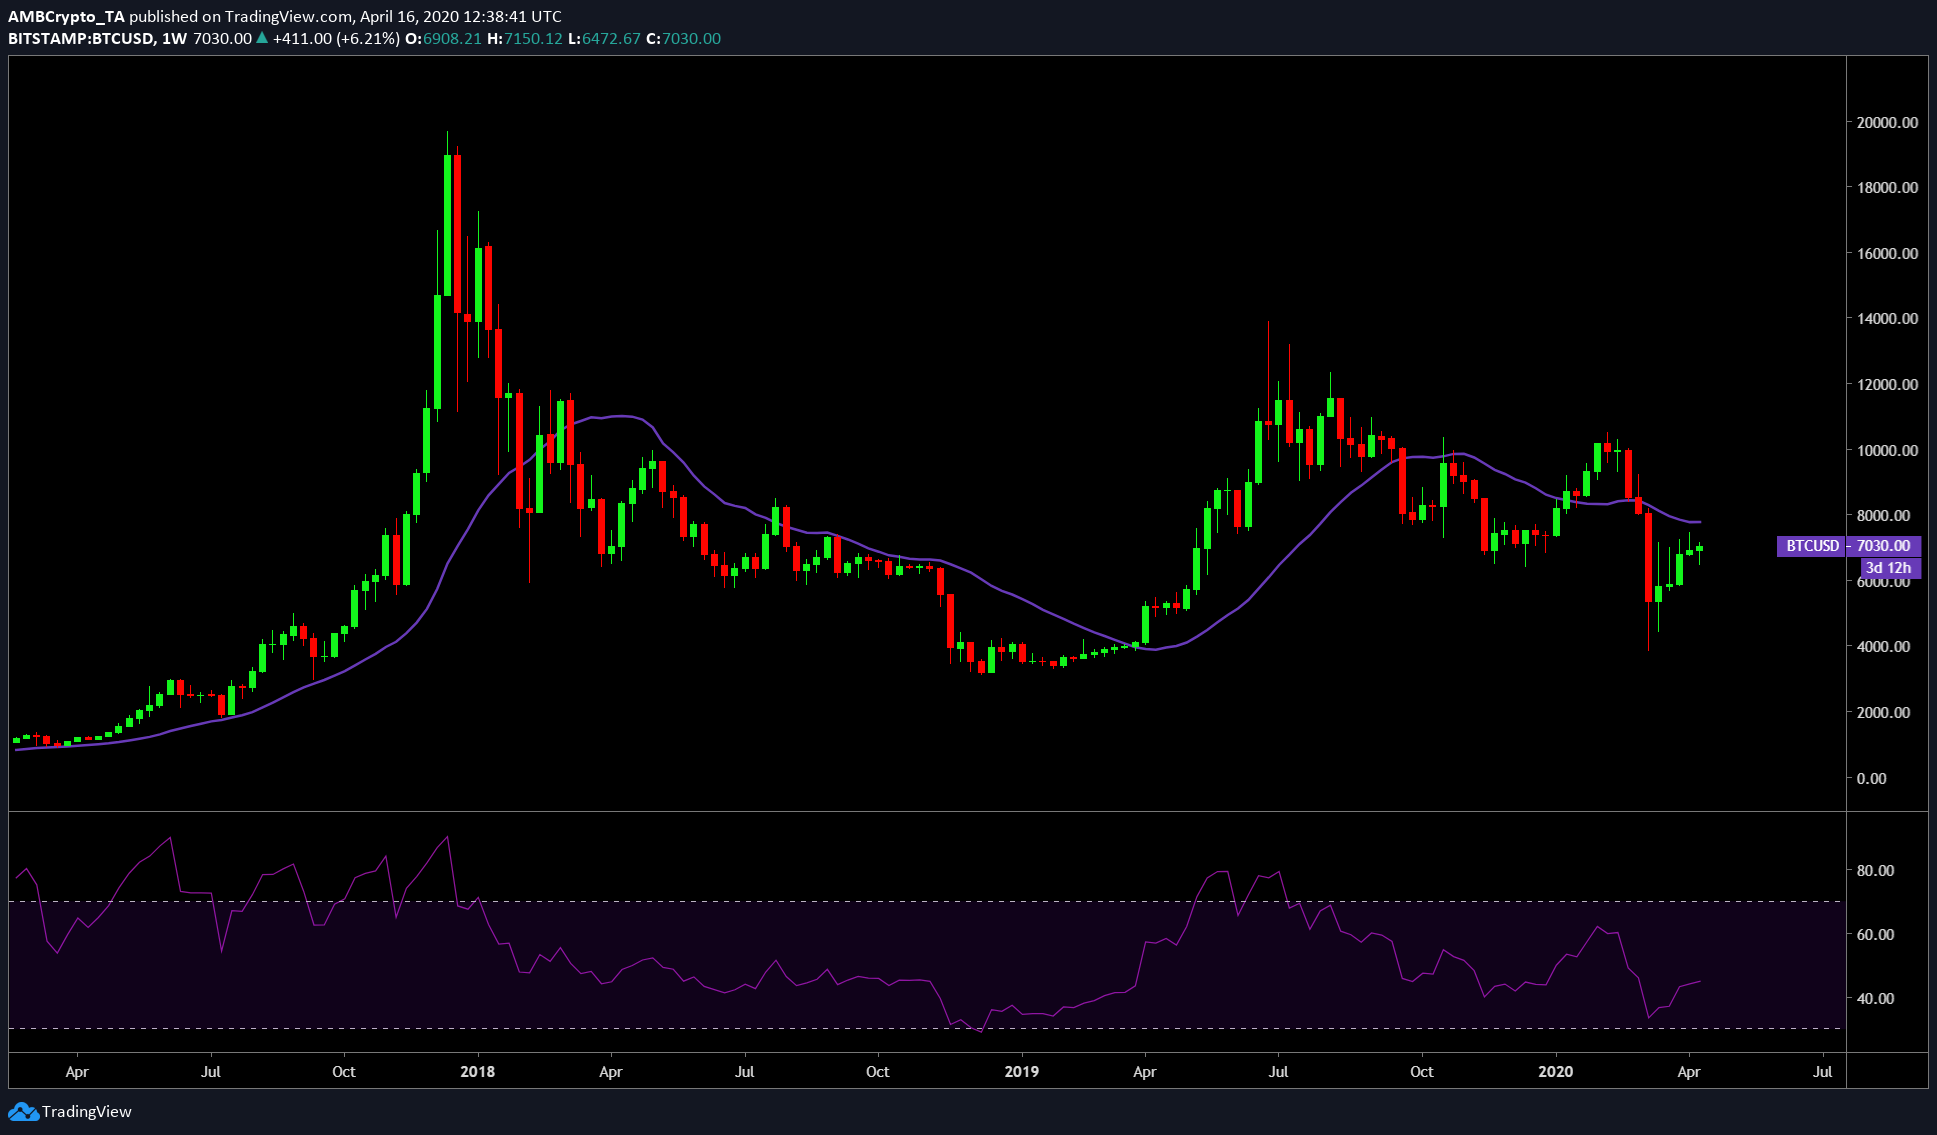
Source: BTCUSD TradingView
The weekly chart for Bitcoin was still showing the 5th consecutive green candle for Bitcoin since the 13 March collapse. On this chart, the 21-week moving average [WMA] showed resistance at $7,700. However, this resistance will come into play when the price manages to close above the previous candle’s high at $7,400.
The RSI on the weekly timeframe seemed flat or at least with a minuscule positive slope; however, the weekly close on 19 April will show how the price will move and in what direction.
Conclusion
The daily close will decide how the price will react – blast through the roof like it did today or if it will strut lazily as it did before today’s surge. Ideally, a close above $7,200 on the daily time frame would be positive news for the buyers. However, the deciding factor would be where the weekly candle closes.