The 2020 market crash was godsent for the likes of Bitcoin and gold.
These ‘safe-haven’ assets surged under the spotlight, climbing to record highs as stock markets and long-term treasury bonds both collapsed and countries reacted by slashing interest rates. The main reasons for buying these assets were immediately enhanced, and the price reacted as such, with Bitcoin surging to a one-year high and gold touching a six-year high.
So, it is safe to say that both these assets did what they were meant to, right? Well, sort of.
While both Bitcoin and gold dropped as people started selling off everything from their stock portfolio to their wedding rings for toilet paper and other “essential” items, the crypto and the commodity saw stronger recoveries. Both Bitcoin and gold jumped from its lows in March to its highs in the second half of the year, but which one had the better run? Shouldn’t that be a question you ask of your safe-haven assets?
Let’s lay down the broad numbers, Bitcoin’s lowest daily price for the year was $5,059. This was Bitcoin’s lowest daily close as while it dropped to below $4,000 on that fateful day of 12 March, it managed to recover over $5,000. On the other hand, gold’s lowest daily price for the year was $1,480, which it saw at the end of March.
Now that we have our lows, how does each asset’s price stack up against them? Well, with Bitcoin beginning the year at over $7,000 and not going below $9,000 after May, the cryptocurrency’s low was far from its price throughout the year.
For gold, however, the case was different. The yellow metal began the year just above $1,510 and strayed down in March, before rising up in June through August and getting bogged down in September. Even these two sentences are enough to paint what is a bleak picture for gold against a positive one for Bitcoin, against the two safe-haven assets’ lowest points. But, let’s go a step further.
Measuring the difference against the lows with the trading price of each asset, we get this chart,
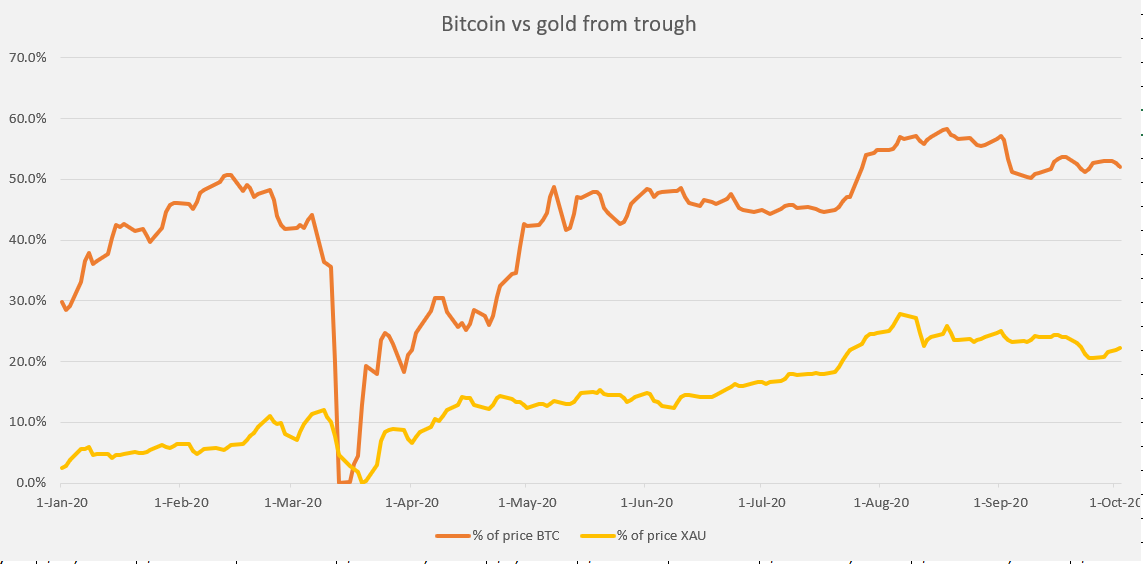
At first, this might look like a barely normalized price chart, but it isn’t. Notice the y-axis is not dollars, but percentage. This measures the difference of the asset’s price against its lows, meaning that Bitcoin jumped way over its lowest point in 2020 by an average of 43.1 percent, while gold’s average was 14.2 percent.
This means that Bitcoin’s daily trading price on average was taking 43.1 percent from the lows of March, while gold was only taking 14.2 percent. Not only does this highlight weaker recovery for the commodity, but it underlines the drop because of which gold can’t seem to extract more from its lows.
While at face value the key takeaway from this would be that it’s better to buy the Bitcoin dip than the gold dip, it’s also better to dollar-cost average Bitcoin than gold because the cryptocurrency is always giving you more from its lows than the commodity ever has.