Bitcoin SV short-term Price Analysis: 5 October

The start of October has been an unceremonious one for Bitcoin SV with the price unable to break away from its $150-$160 range. With the trend appearing a little less bullish every single day, the market had its hopes pinned on Bitcoin or Ethereum to trigger a rally. Although price-wise the top two assets were solidifying their base, Bitcoin SV pictured a similar outlook as well. At press time, Bitcoin SV’s position continued to remain at 12th with a $3 billion market cap.
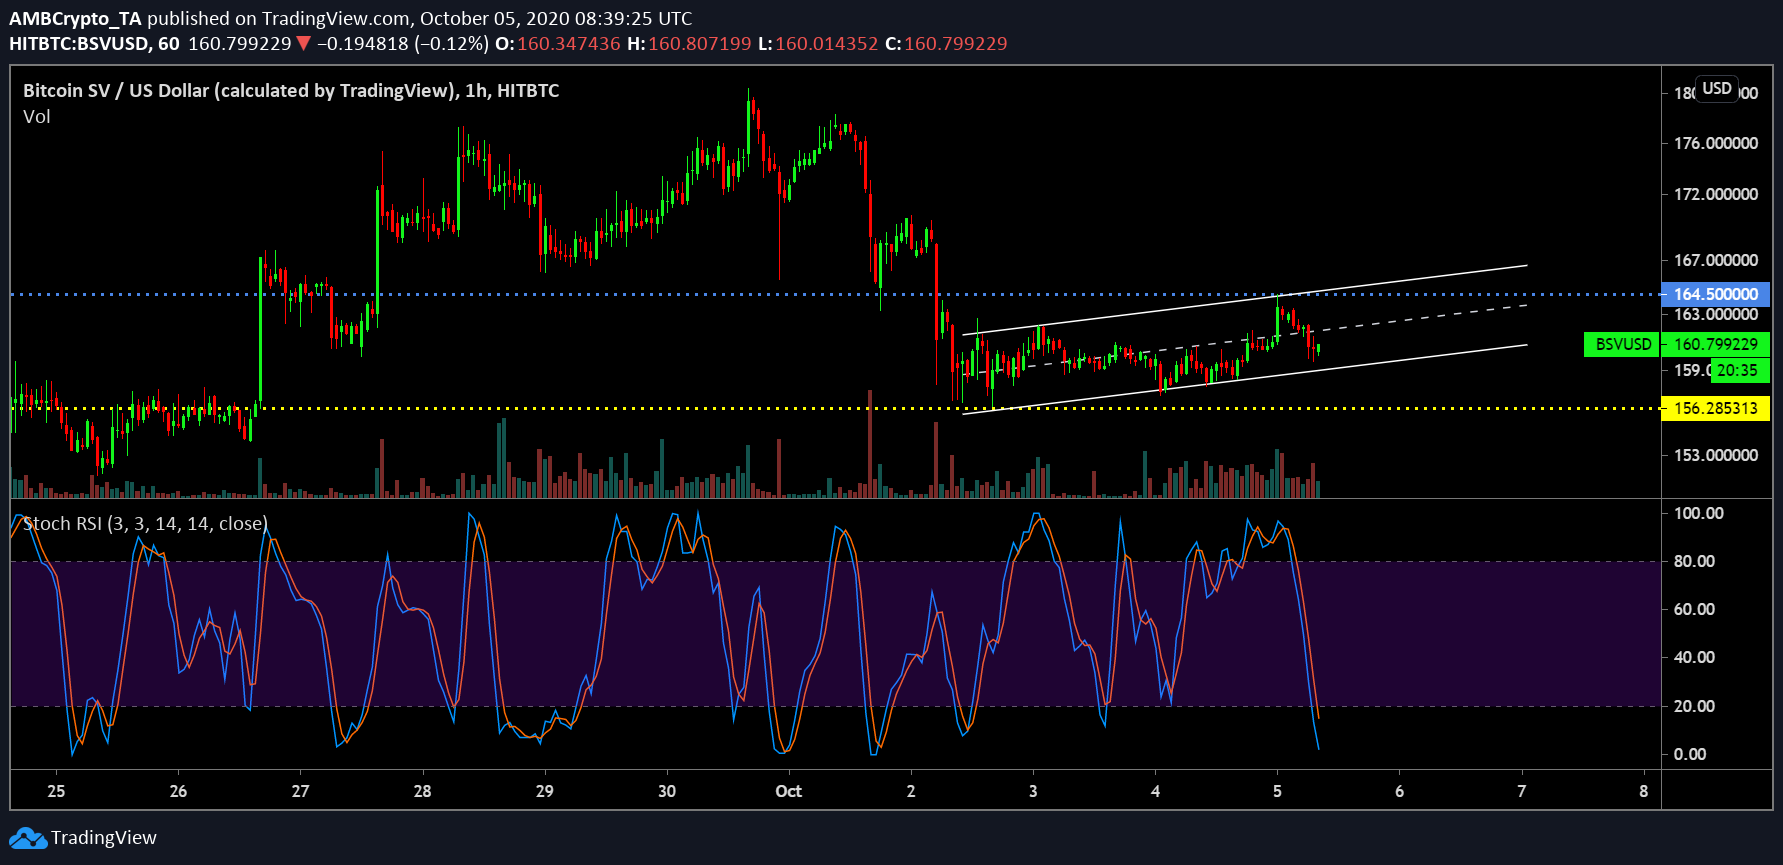
Bitcoin SV 1-hour chart

Source: BSV/USD on Trading View
For Bitcoin SV, the price range has been more or less constricted between the support of $156, and the resistance ar $164.5 While the resistance and support have both been tested on different occasions, there hasn’t been a breach in the pattern. The pattern is question remains a slightly ascending channel carrying minor bearish implications.
While the 1st-2nd October slump seemed brutal, the price hasn’t given in to a complete onslaught. Recovery hasn’t been great either but if the trading volume is observed, activity was still significant for the asset.
With the Stochastic RSI reaching an oversold position with a bearish picture at the moment, a reversal is near for Bitcoin SV. However, in the short-term, the price is possibly taking another dip.
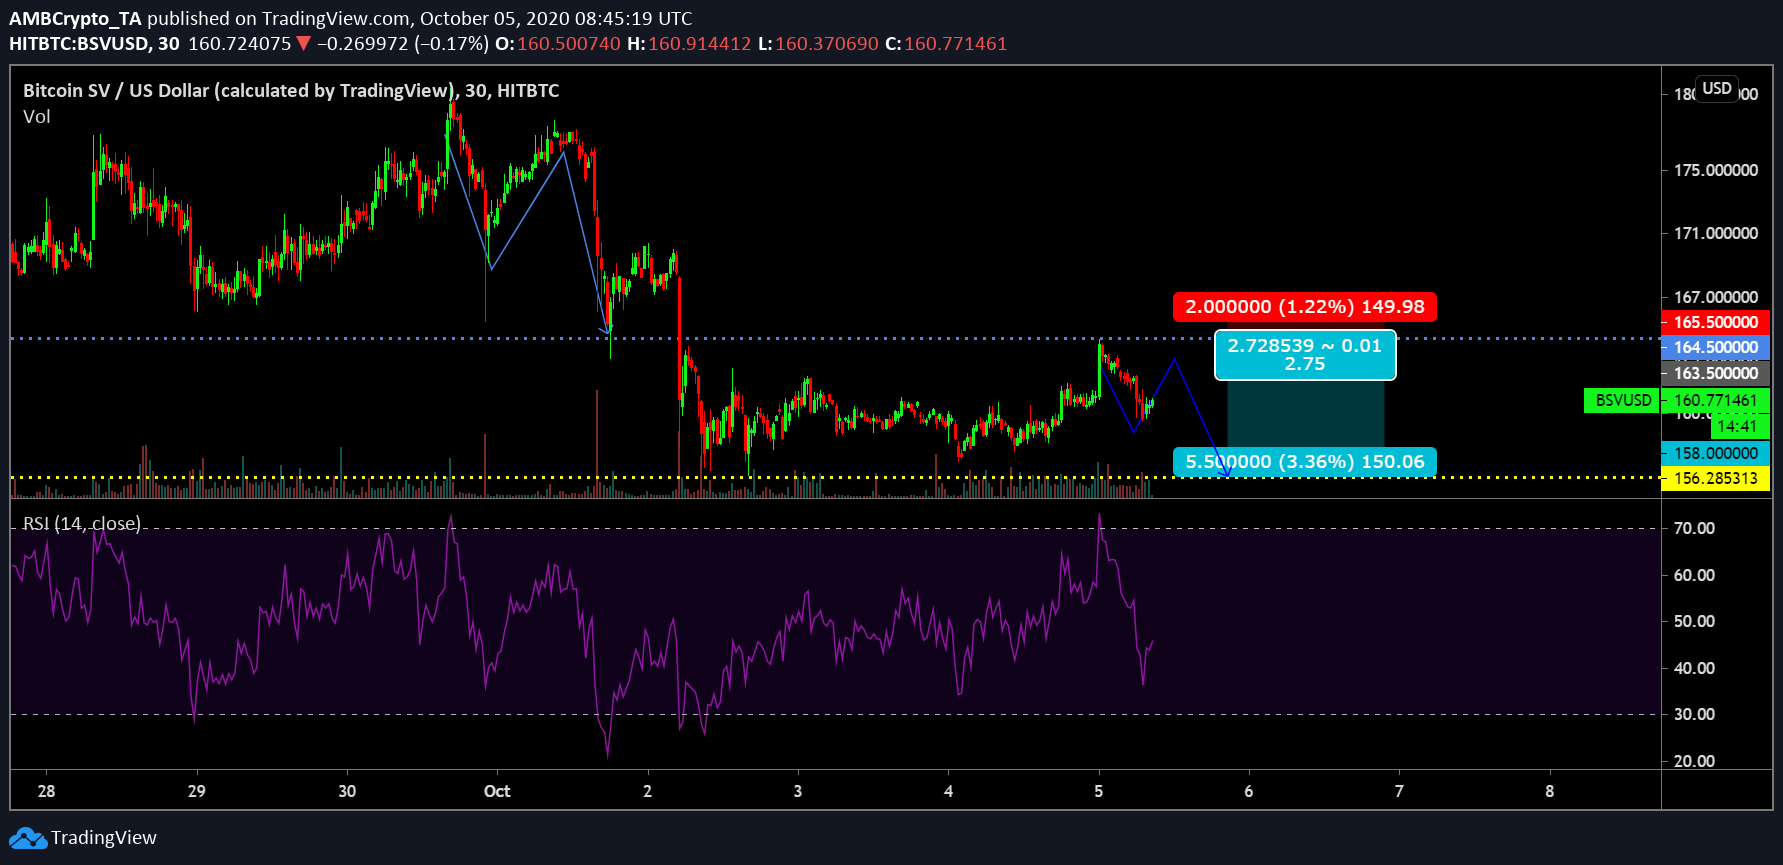
Bitcoin SV 30-min chart

Source: BSV/USD on Trading View
From a short-term perspective, Bitcoin SV‘s price is looking lively at the moment but for a short-term pullback. Drawing similarities to the bearish breakout on 1st-2nd October, a period may ensure a repetition. While the price may go up over the next few hours, another re-test near the support $156 might take place. For bearish traders, a short position can be opened at $163.5 for a Risk-Reward of 2.75x, with profits taken at $158 and limiting the stop loss at $165.5.
With Relative Strength Index or RSI, the buying pressure will stabilize the indicator but bearish momentum will pull it back from 50.00 for a possible positioning in the oversold zone.


