Bitcoin SV, Ethereum Classic, VeChain Price Analysis: 09 September

Bitcoin was able to defend the $10,000 level but the rest of the cryptocurrency market saw red as selling pressure hadn’t been completely exhausted. At press time the king coin was being traded at $10,192 with a 24-hour trading volume of $86.5 billion.

Source: CoinStats
Bitcoin SV exhibited a bearish pattern and could be poised for a drop. Ethereum Classic formed a bearish pattern that could see its price drop to the next level of support. VeChain struggled to move above a 20 period moving average and showed it was still under bearish pressure.
Bitcoin SV [BSV]

Source: BSV/USD on TradingView
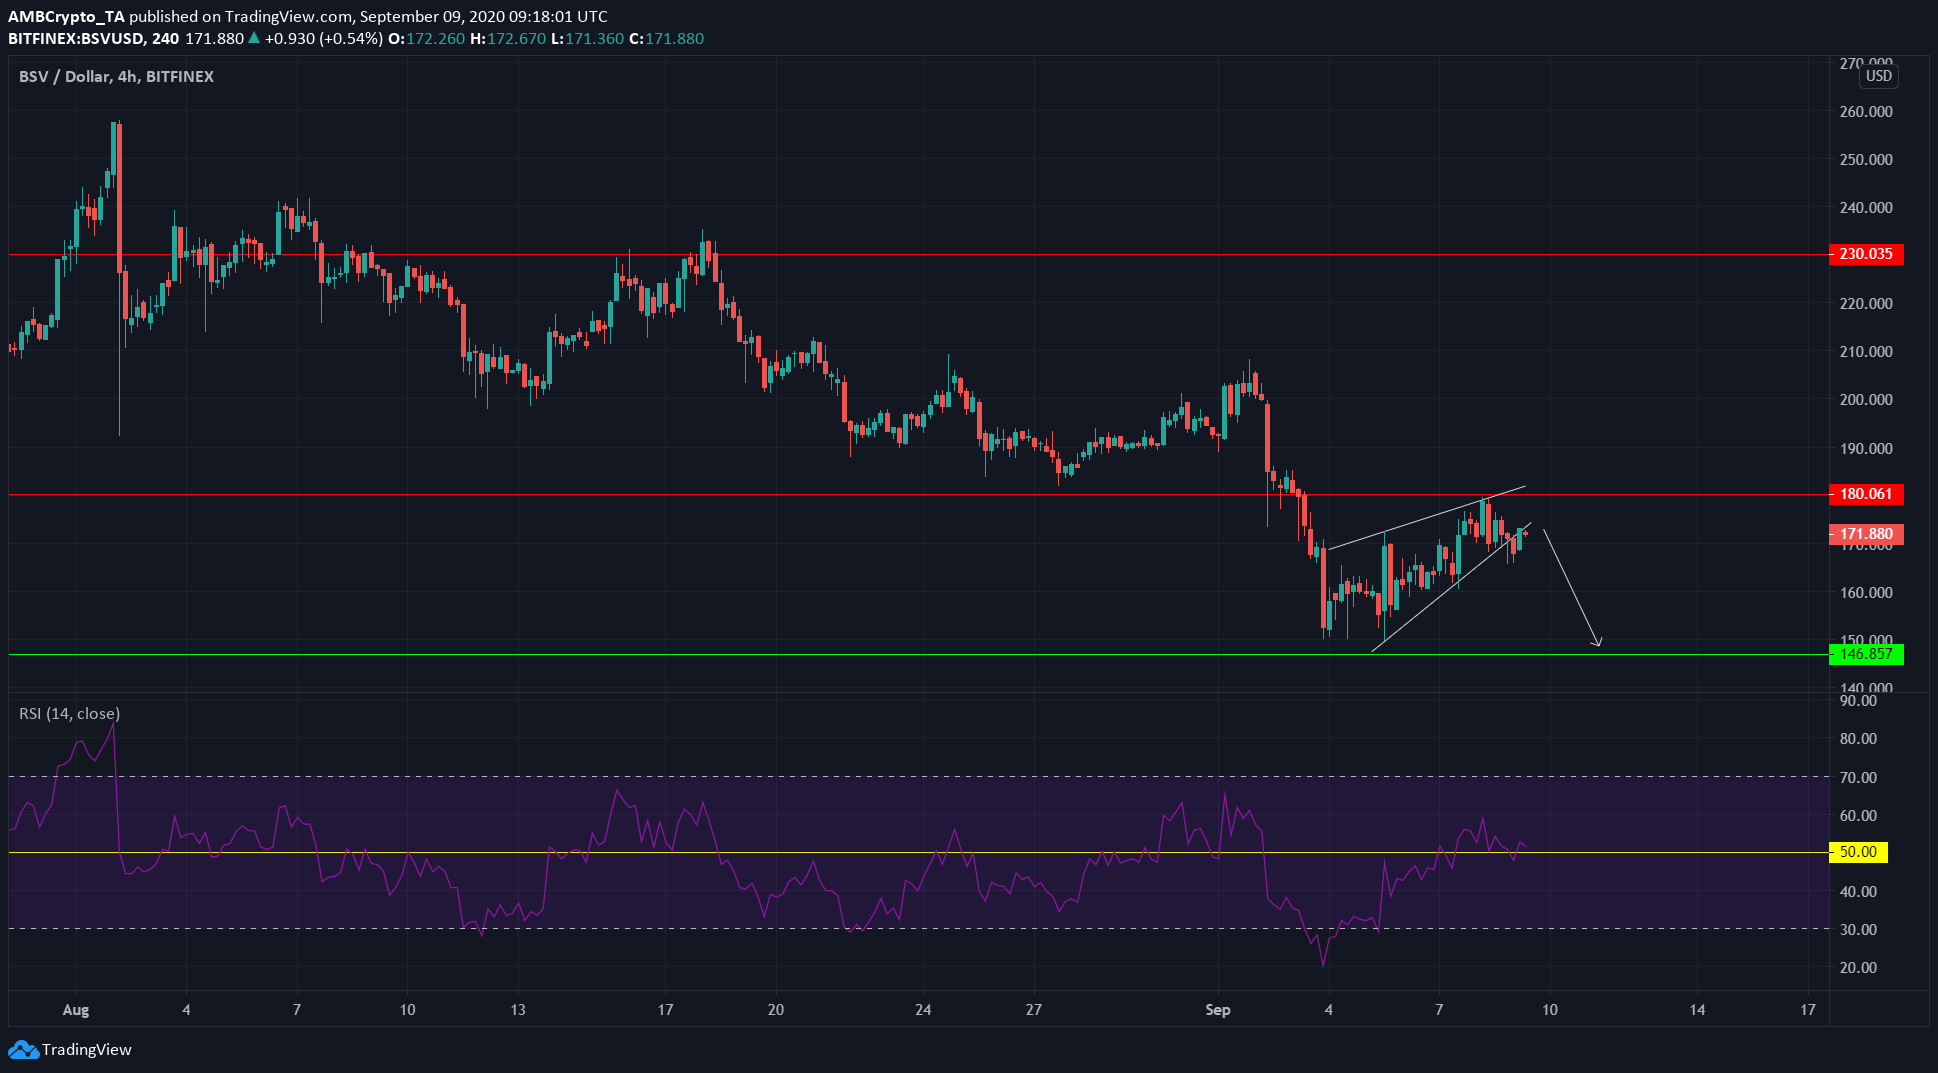
BSV formed a rising wedge, a bearish reversal pattern. Price had been in an uptrend for the past few days but it could change.
BSV is likely to drop once more to find support in the $146 region. $150 has also served support, and we can expect the zone from $145 to $150 to have buyers.
Price met resistance at $180 region and slipped lower but some trading sessions saw strong buying sessions. It remained to be seen if those were isolated candles or if they were indicative of a rise past resistance.
RSI has been in the neutral region around 50 for the past few days.
Ethereum Classic [ETC]

Source: ETC/USD on TradingView
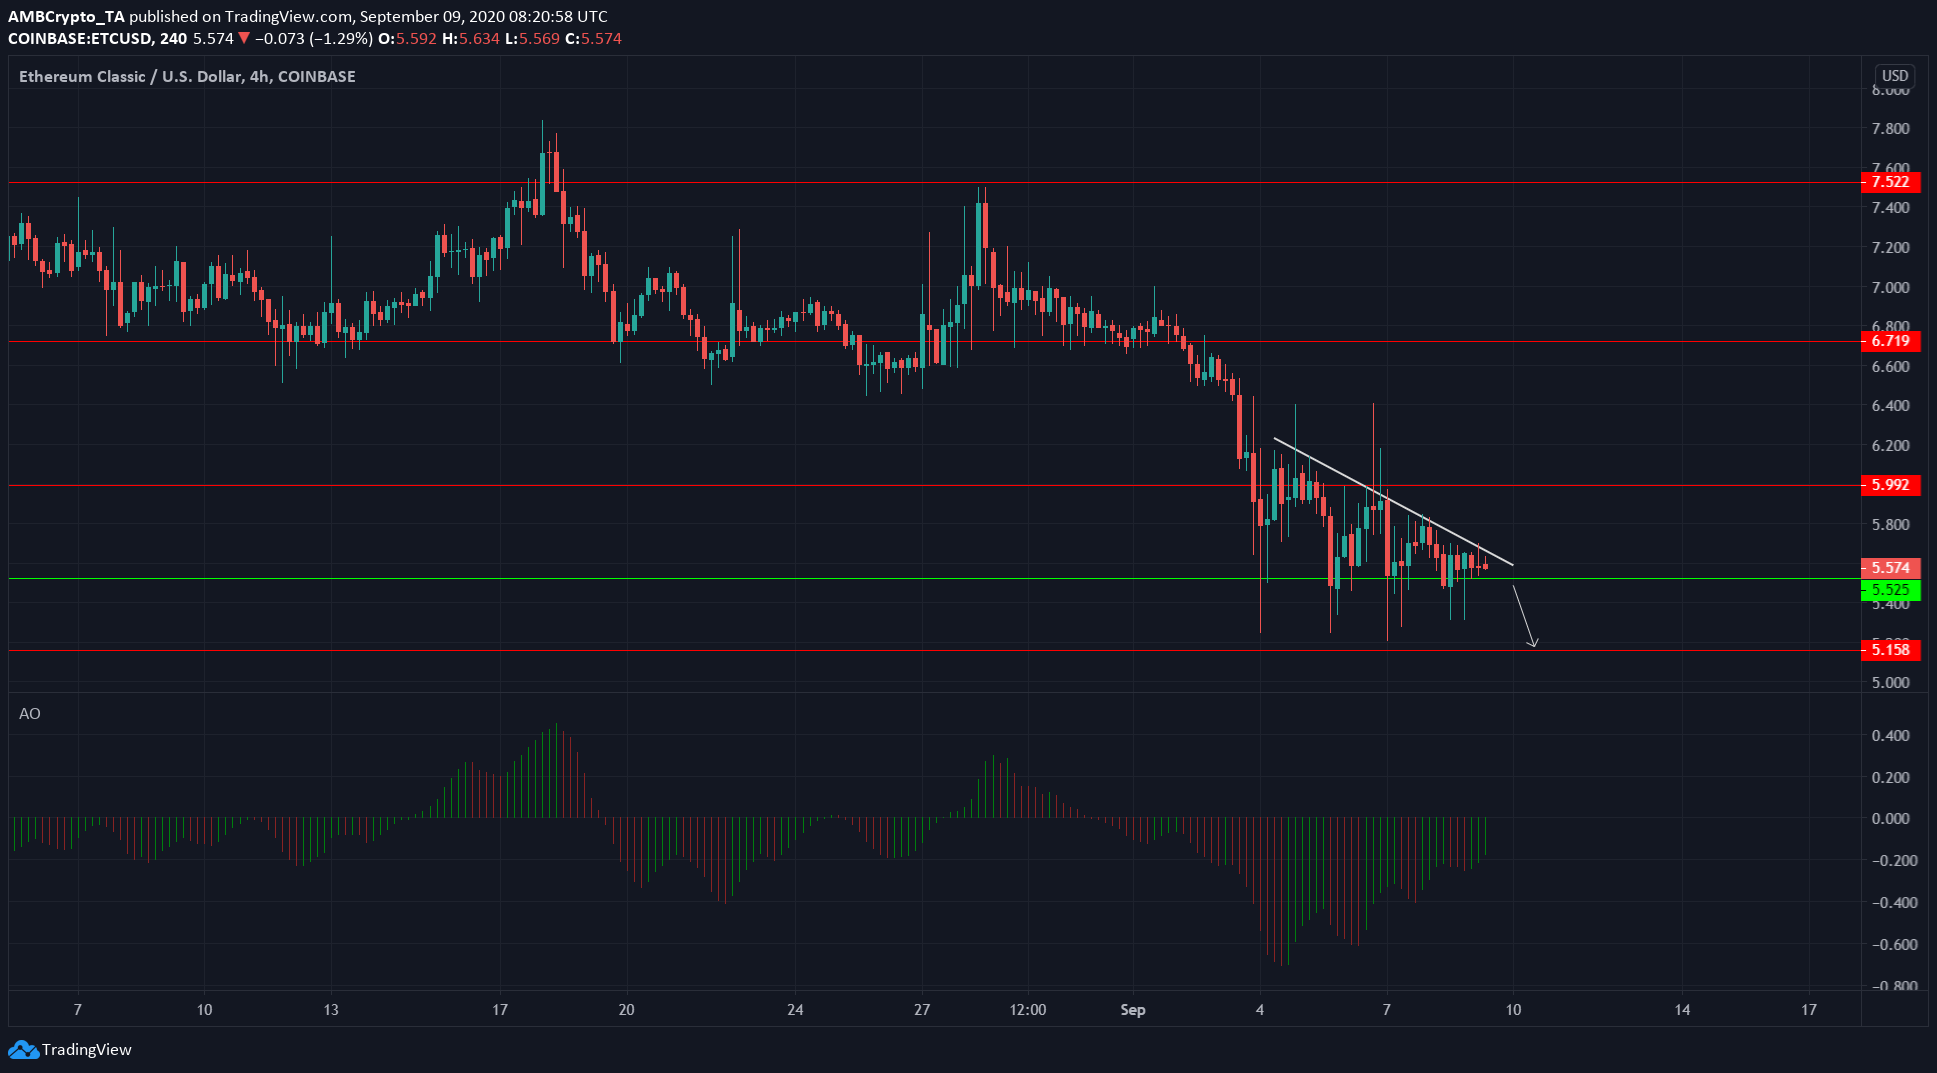
Ethereum Classic has failed to close above the white trendline, indicating a short term bearish trend. It also has been forming lows at the support level of $5.52. This has formed a descending triangle pattern. If validated, the price could drop toward the next region of support at $5.1.
At press time, ETC was trading just above support, valued $5.58. Awesome Oscillator showed a diminishing bearish momentum. However, with the triangle pattern, it is normal for momentum to reduce as price approached the end of the pattern.
The bearish pattern would be invalidated if the support of $5.52 holds over the coming days.
VeChain [VET]

Source: VET/USD on TradingView
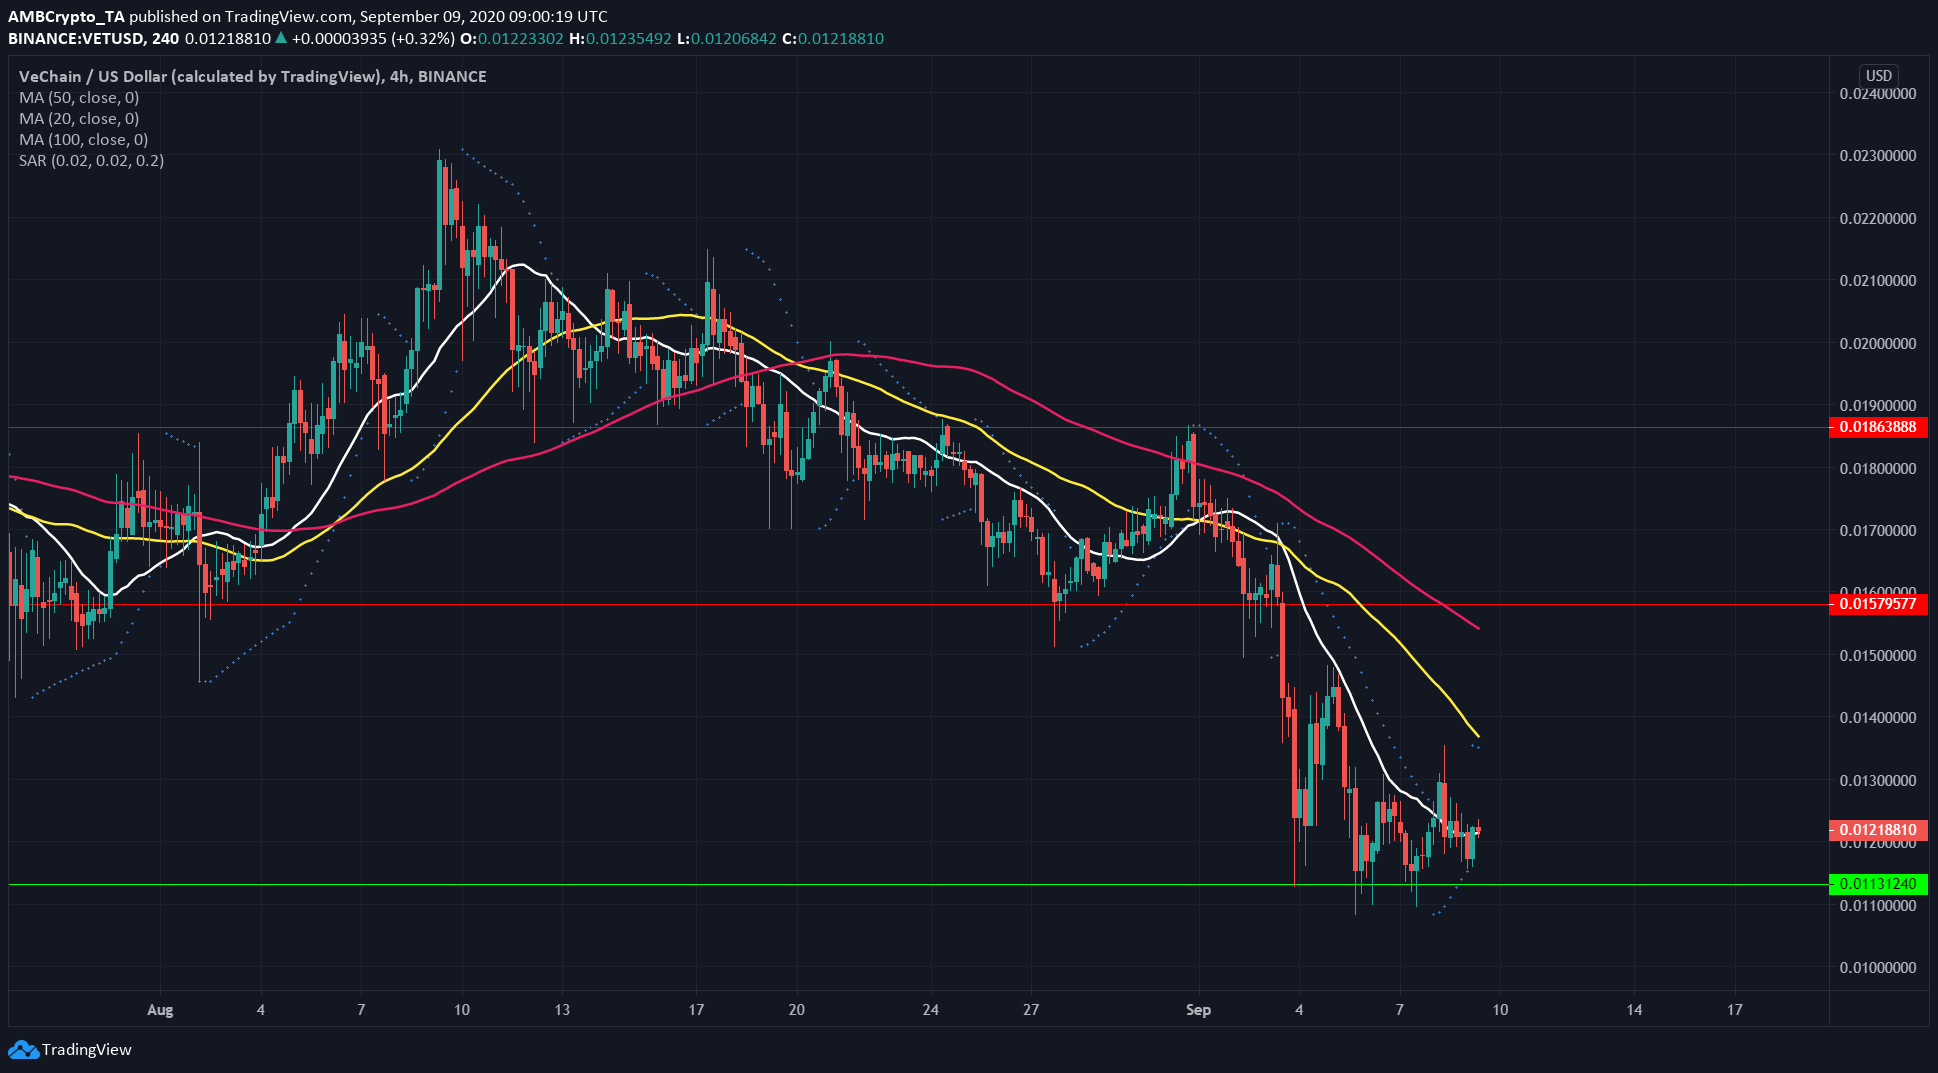
VeChain continued to form lower highs. The price was trading right at 20 SMA (white) at the time of writing. Parabolic SAR gave a sell signal, with the indicator’s dots being near 50 SMA (yellow). This indicated the asset is in a strong downtrend and has to reclaim 50 SMA and 100 SMA (pink) before trend reversal was confirmed.
In other news, BitPanda announced the listing of VeChain on their exchange.


