Bitcoin SV lost recent gains after Bitcoin dipped to $11,600 from $12,500. However, Bitcoin SV might be able to sustain a move upward. ATOM showed signs of weakness in the market as bearish momentum seemed to gain traction. Synthetix was trading just above its support and endure some short-term price loss before resuming its prior uptrend.
Bitcoin SV [BSV]

Source: BSV/USD on TradingView
Bitcoin SV retraced nearly all its gains from the past week. It formed a symmetrical triangle pattern (white) from the beginning of its uptrend on July 19. This triangle is a continuation pattern and if BSV can reclaim $230 support and rise, the pattern would be vindicated.
CMF showed a decrease of capital into the BSV market, with a value of +0.12 at press time. This was a weak but bullish value.
Some news related to Bitcoin Sv was the announcement from Centi that they were concluding their first funding round headed by Calvin Ayre and Dr Jurg Conzett.
Cosmos [ATOM]
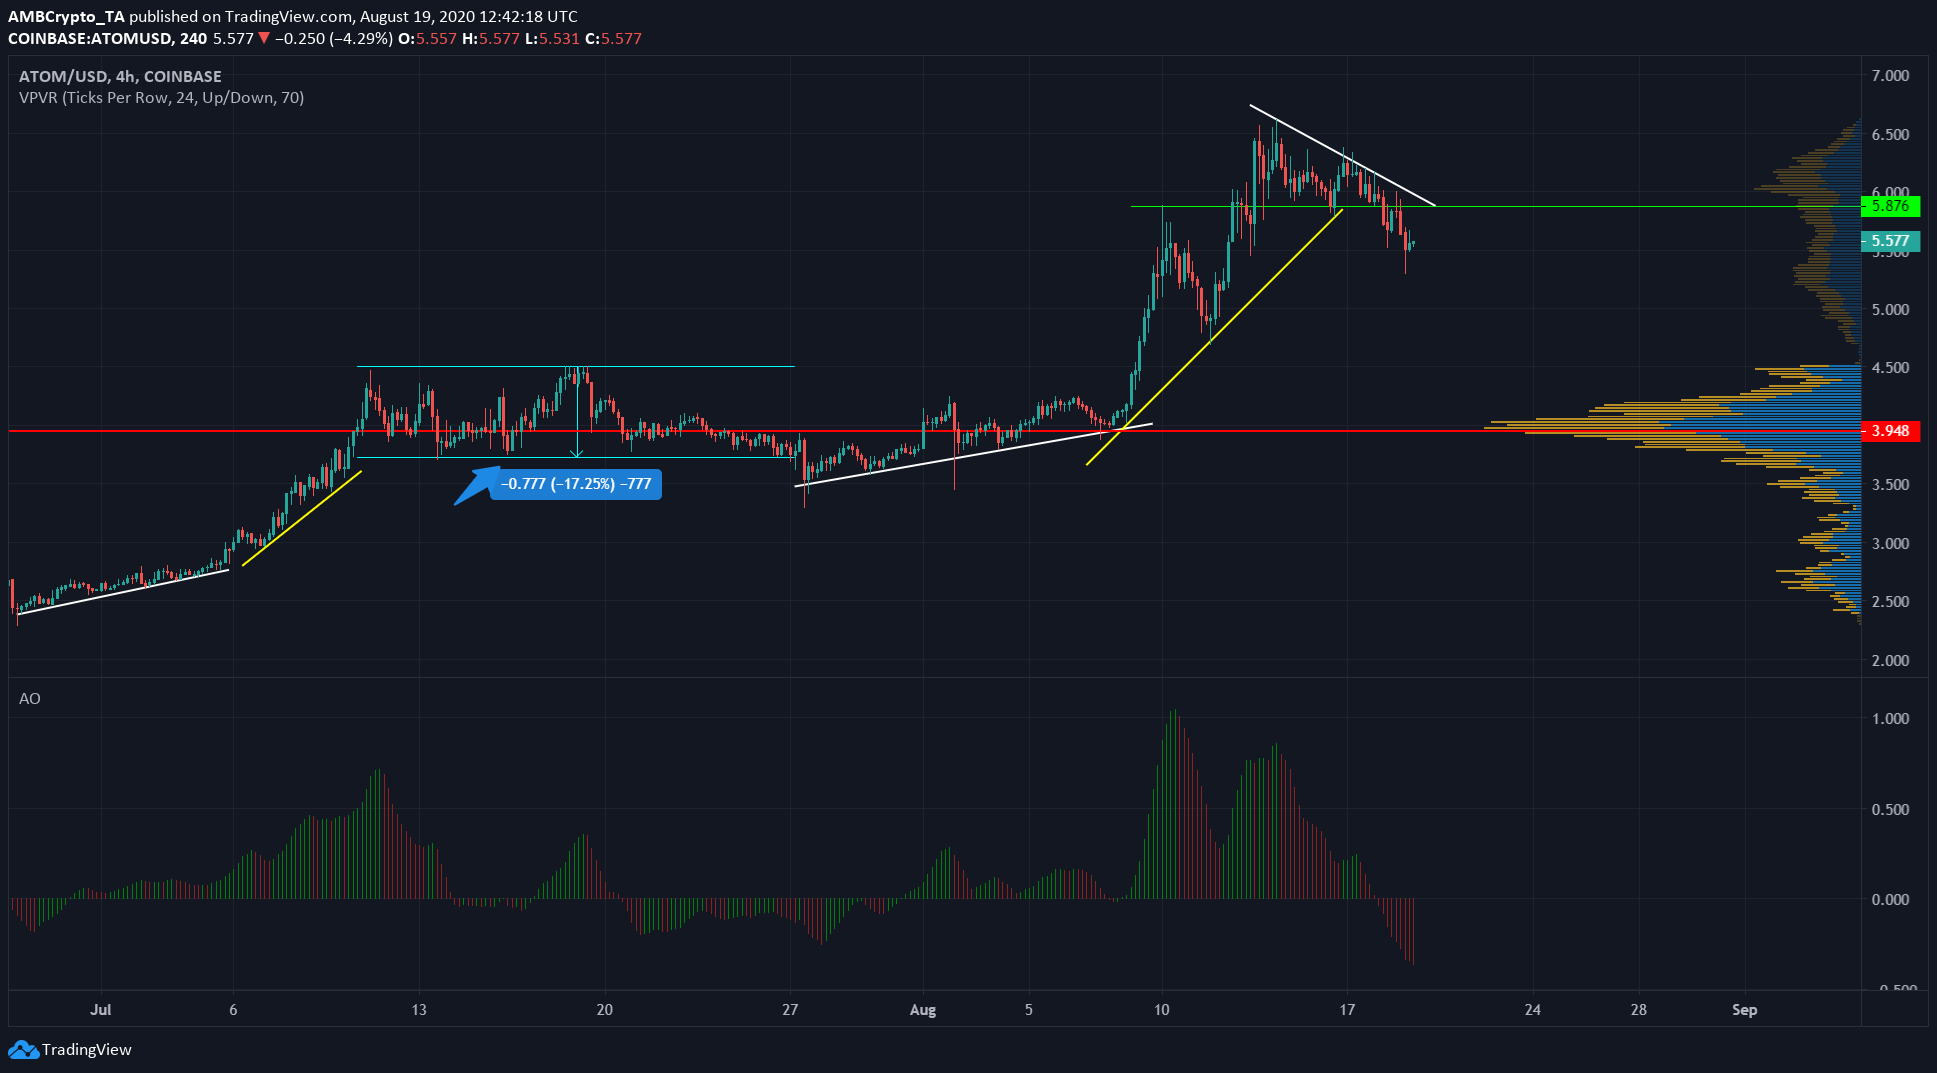
Source:ATOM/USD on TradingView
ATOM did not consolidate above its support, as pointed out previously to be a possibility. Rather it bounced weakly off support at $5.87 before a drop to $5.5.
Volume Profile showed that the significant levels were at $6 and $5.8 as resistance. The region near $5.3 and $4.5 can act as the next support if ATOM did break downward.
Awesome Oscillator showed a shift in momentum to bearish in the short-term. This could propel ATOM as low as $4.5 if sustained.
Synthetix [SNX]

Source: SNX/USDT on TradingView
Synthetix was trading at $6 at press time, after a strong uptrend. Support lay at $5.9, with resistance near $6.37.
RSI might be indicating signs of a downtrend for SNX. The longer the RSI fails to break past 50 mark, the more likely it becomes that SNX would enter a downward trend. At press time, RSI was 49.5.
The 20 SMA (white) was positioned above the trading price while 50 SMA (yellow) acted as support. For the short-term, this is a bearish signal but confirmation of further sell pressure would be needed before acting on the shorter-term signals from 20 and 50 SMA.
In related news, Synthetix announced that it will be partnering with xToken to allow an easier method of staking of SNX to earn rewards in the form of xSNX. However, xToken tweeted a warning about an issue involving minting xSNX.