Analysis
Bitcoin SV, Algorand, BAT Price Analysis: 12 September

While Bitcoin had been threatening to fill the CME gap at $9,600, at the time of writing, it seemed like BTC might stay clear of the gap, with the cryptocurrency trading under its resistance level at $10,400. Bitcoin SV could be headed south to touch its support level, while Algorand showed signs of consolidation above its own support. On the contrary, Basic Attention token was weakly bullish on the charts.
Bitcoin SV [BSV]

Source: BSV/USD on TradingView
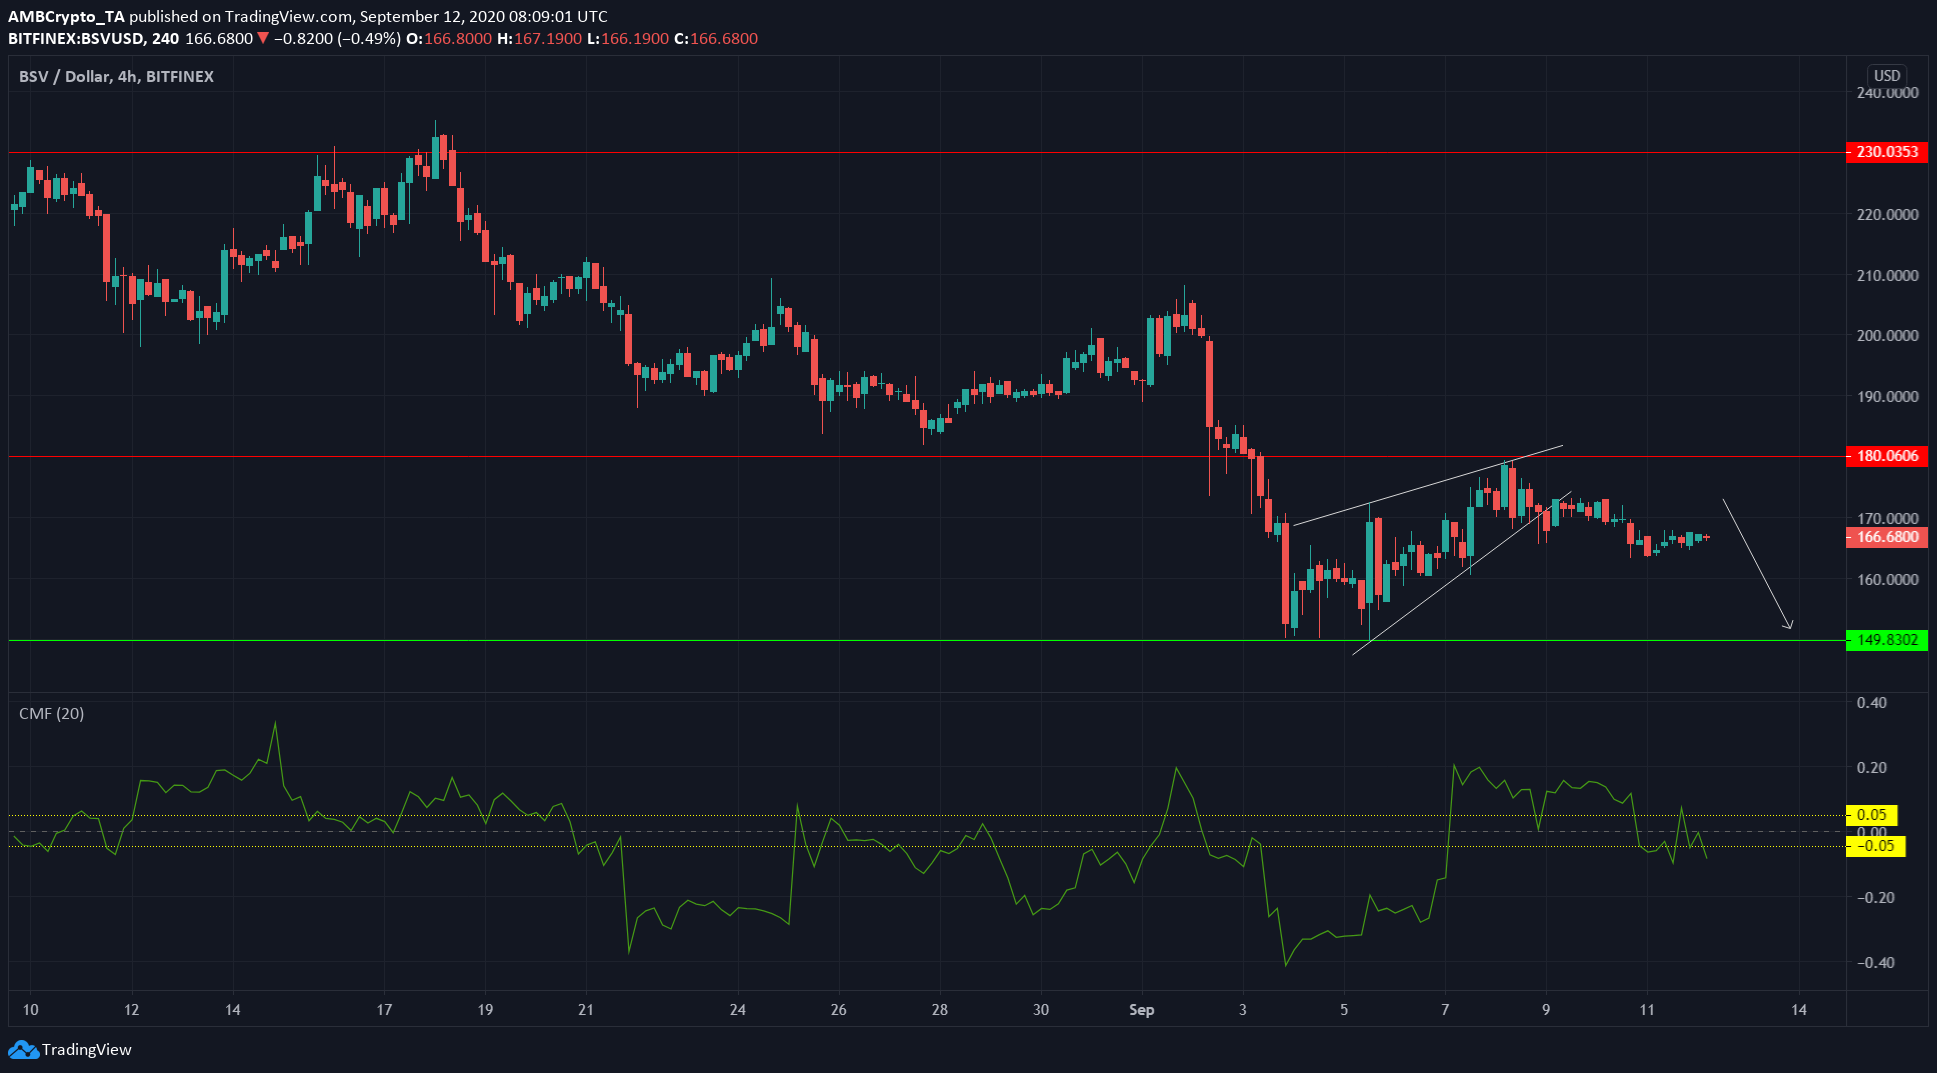
Bitcoin SV had formed a rising wedge, a bearish reversal pattern, on its charts. While BSV had not dropped towards its support at $166 at press time, its price movements still showed some degree of bearishness.
The price was unable to ascend towards its resistance and the Chaikin Money Flow underlined capital outflows from the market, a sign of growing selling pressure in the BSV market, especially if the CMF continued to drop.
BSV must move above its resistance level at $180 before it could initiate any long-term uptrends.
In fact, interest in Bitcoin SV seemed to be increasing as the Bitcoin Association announced new fiat on-ramps to acquire BSV, having recently been introduced by 11 digital asset exchanges.
Algorand [ALGO]
Source: ALGO/USD on TradingView
The RSI was at 52, which is a neutral value, but in this context, was bullish. The RSI has not dropped below 50 in the past few days, having flipped the neutral 50 line from resistance to support as ALGO flipped resistance level at $0.4 to support.
Since flipping, the trading volume has been below average, but showed no increasing or decreasing trend. There are likely to be a few sessions of consolidation, before another move up.
In related news, after Ethereum, Algorand is the second major blockchain with native support for Centre Consortium’s stablecoin USDC.
Basic Attention Token [BAT]
Source: BAT/USD on TradingView
BAT was trading at $0.265, right underneath the 78.6% retracement level at $0.269, at press time. The Fibonacci Retracement tool also highlighted some other important levels such as the 61.8% retracement at $0.3.
The Awesome Oscillator suggested that momentum was in bullish territory, however, the histogram indicated that it was weakly bullish momentum.
If BAT sees another wave of selling pressure, it could drop past level $0.2219 and undo all the gains made in August to find support at the $0.2 level.

