
As it consolidates for almost 40 days, bitcoin stands at $9,271 with a market cap of $170 billion. The top cryptocurrency has seen a 0.35% surge in the last 24 hours and has a 24-hour trading volume of $3.37 billion, making it the second-largest traded asset in the entirety of the crypto ecosystem.
Bitcoin 4-hour chart
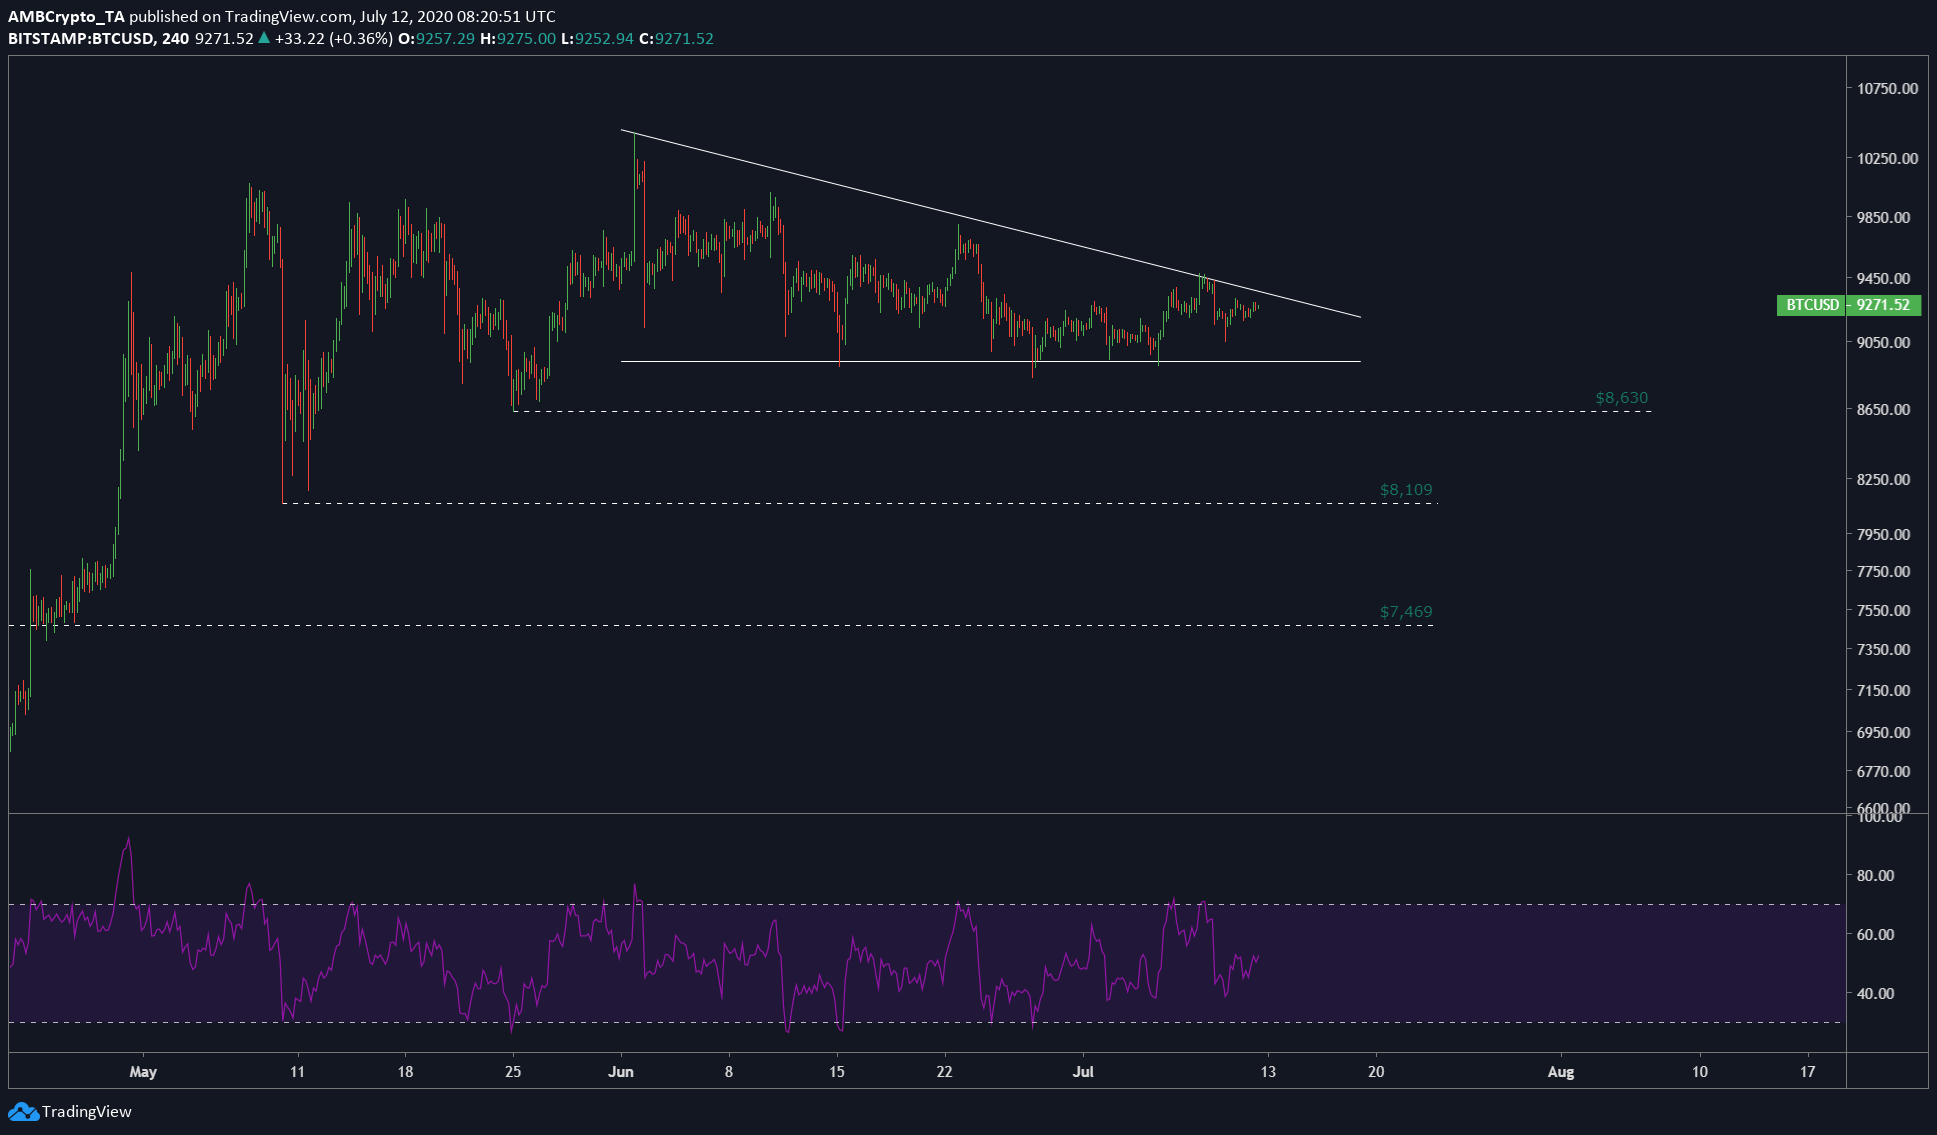
BTCUSD TradingView
The four-hour chart of BTC showed the consolidation pattern that has a bearish bias, indicating an incoming drop. This comes at a time when BTC’s dominance in the ecosystem has dropped and that of altcoins’ increased. This indirect relationship has caused a lot of altcoins to surge in the past week or two. A noteworthy surge would be Dogecoin’s pump as a result of the Tik Tok video challenge.
The descending triangle is almost close to completion, hence a breakout can be expected soon. Considering the bearish bias, the price can be expected to test the following supports.
The immediate support stands at $8,630, which is approximately 3.31% from the base of the descending triangle or a total of 7% drop from the current price. Additionally, if sellers dominate the breakout, then a breach of the aforementioned support can be expected. Hence, the next logical support to be tested is $8,109, which is a 9.30% drop from the base of the triangle.
Direction of the breakout
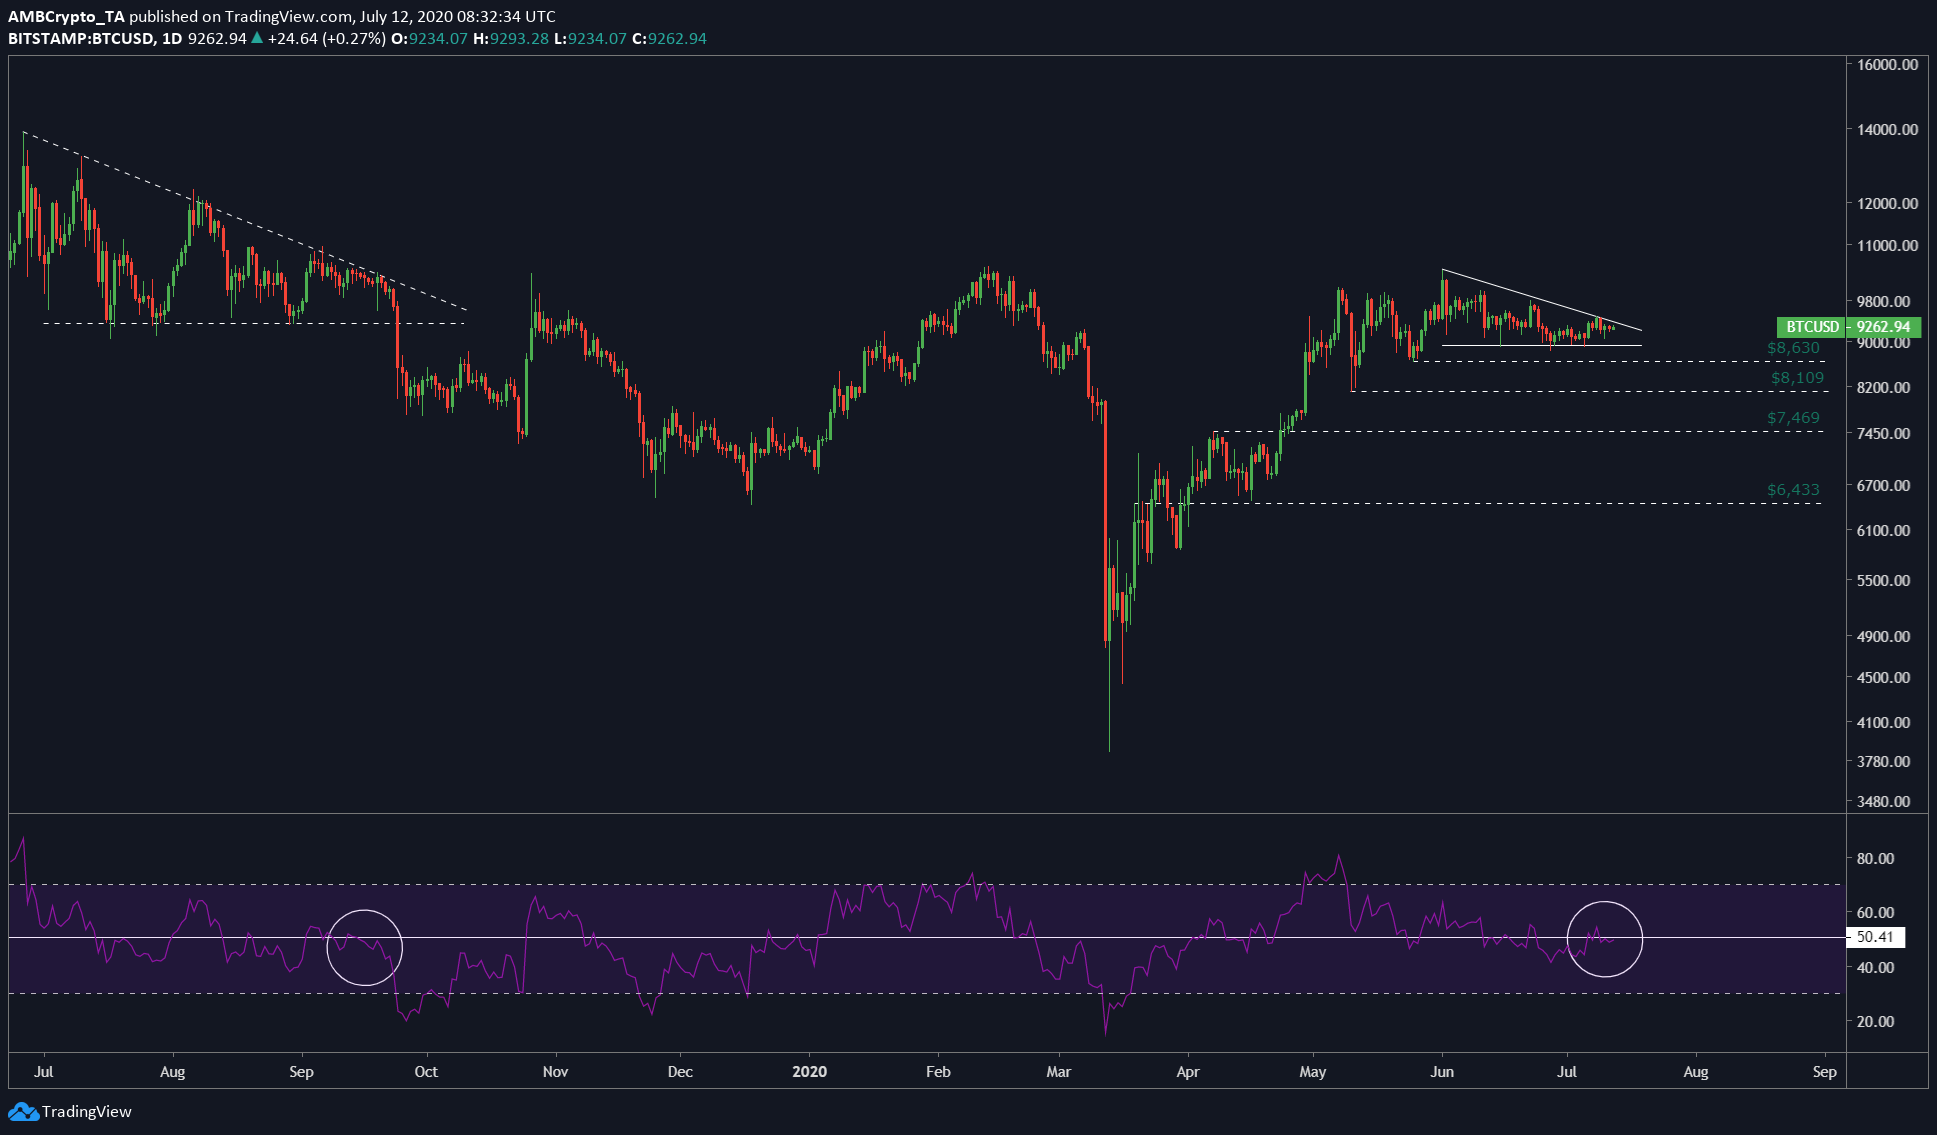
BTCUSD TradingView
What’s interesting about a similar pattern seen in September 2019 is that it was hugging close to the sloping line of the pattern just before the brutal breakout. The same can be seen with the existing pattern. While the price was trading close to the sloping line [in September 2019], RSI was near the 50-line trying to decide the breakout direction; again, the same can be witnessed with RSI at press time.
Due to these striking similarities and pre-existing pattern bias, a drop is almost sure. The breakout is “almost bearish” and not 100 percent since the bear market has been extended for over 2.5 years and it’s just about time the bull run to begin. Based on RoI cycles, BTC is due for a bull run and is exhibiting similarities to the pre-bull run phase of 2016.