Analysis

Bitcoin looks bearish yet outperforms top 100 cryptos; Altcoins find a way to rise as BTC dominance takes a break
Posted:
| Last updated: January 12th, 2024
The cryptocurrency ecosystem is in a swirl as Bitcoin prices collapsed by more than 20% a few days ago and the altcoins followed suit. Bitcoin dominance has since cooled off to 69.47% from its prior high of 73.12% during the first week of September. This might be the respite that the altcoins and their holders were looking for.
Regulations and fines are still being set as the SEC continues its hunt for unregulated token sales and ICOs. Block.One was the latest company to face the ax as it was fined a $24 million for an unregistered token sale.
The Chosen 10 and their Performance
A closer look at the top 10 coins shows that Bitcoin Cash, EOS, Litecoin, and Binance Coin took a lot of beating the week Bitcoin collapsed.

Bitcoin Cash crashed the most [-29.17%], EOS crashed by -27.12%, which is surprising considering SEC’s ruling. Litecoin, which underwent halving recently collapsed by -25.68%. Binance’s utility coin BNB, once soared by 500% over 150 days, it has been collapsing ever since. BNB drowned by -25.25%. The remaining coins were also down by 15 to 25%. This collapse in altcoins following Bitcoin is mainly due to Bitcoin being linked to almost all altcoins, giving it sway over these coins. This also creates a correlation between BTC and other altcoins.
In unison, the performance of these top 10 coins has reached to a level that was last seen in April 2019, just before the beginning of the surprise rally.
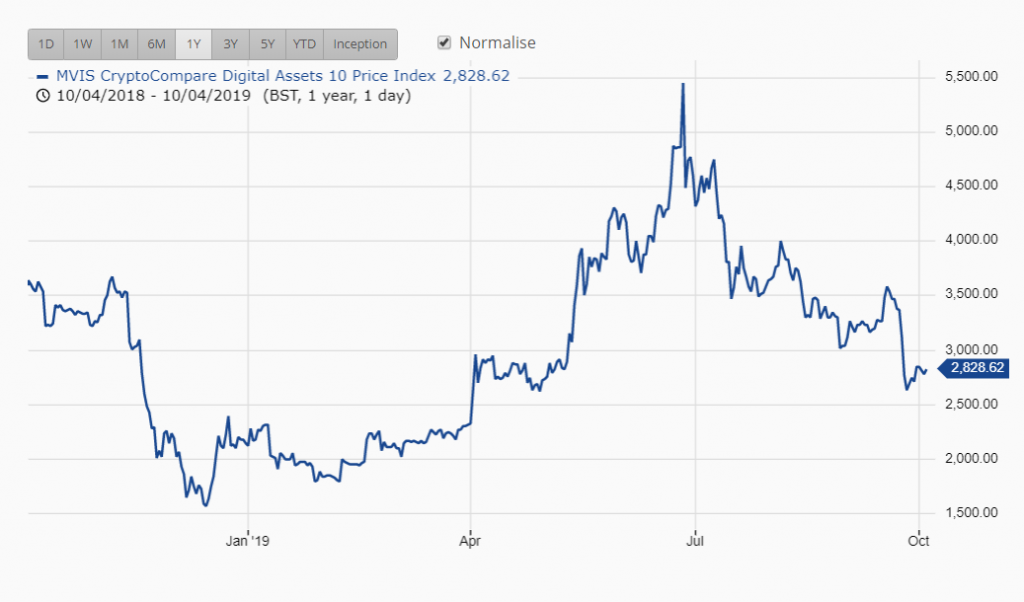
Source: MVIS Index
In over a year, the combination of these coins has negatively performed by 22%, which shows that the crypto market is not out of the bear market yet. However, look at how altcoins have performed against BTC gives a different perspective about the markets.
Bitcoin Vs. Altcoins
Bitcoin has always been the dominant cryptocurrency not just in terms of performance but also with respect to adoption. Moreover, Bitcoin is widely known unlike specific cryptocurrencies, which are known only to users are into cryptocurrencies.
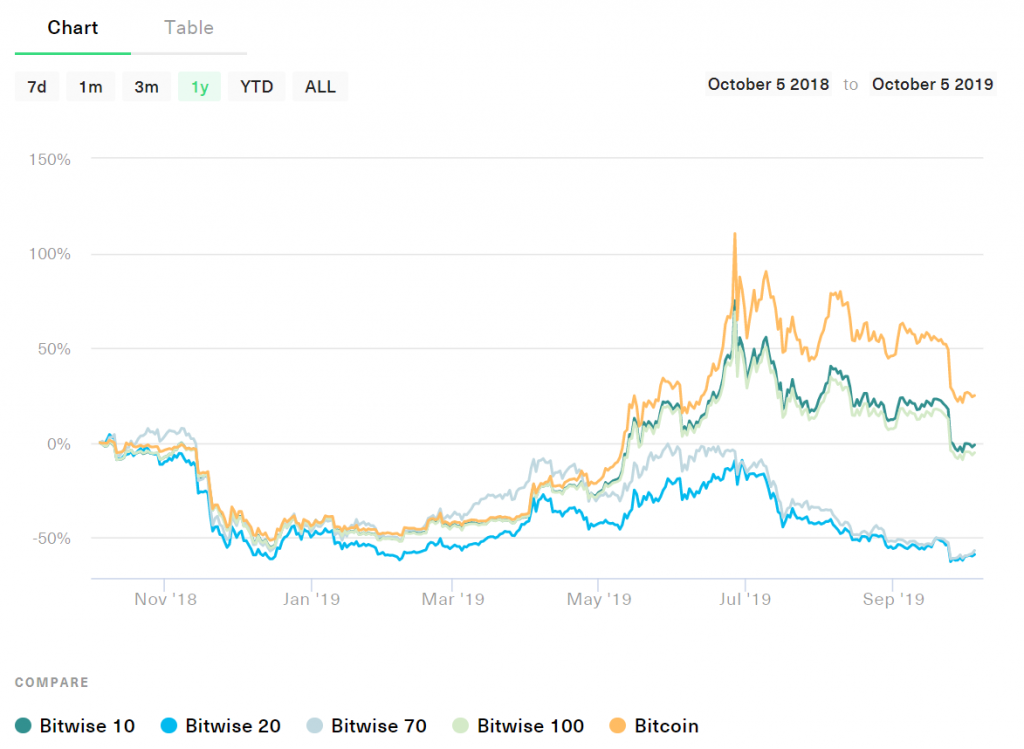
Source: Bitwise Index
Over the course of a year, Bitcoin seems to be performing better than most of the altcoins, in fact, the Bitwise 10 index, which considers the top 10 cryptocurrencies based on market cap, including Bitcoin is also underperforming in comparison to Bitcoin.
Foresight
The one-hour chart for Bitcoin shows that the price is consolidating after the recent collapse; the four-hour chart provides a much clearer picture about what might happen in the near future.
Four-Hour Chart
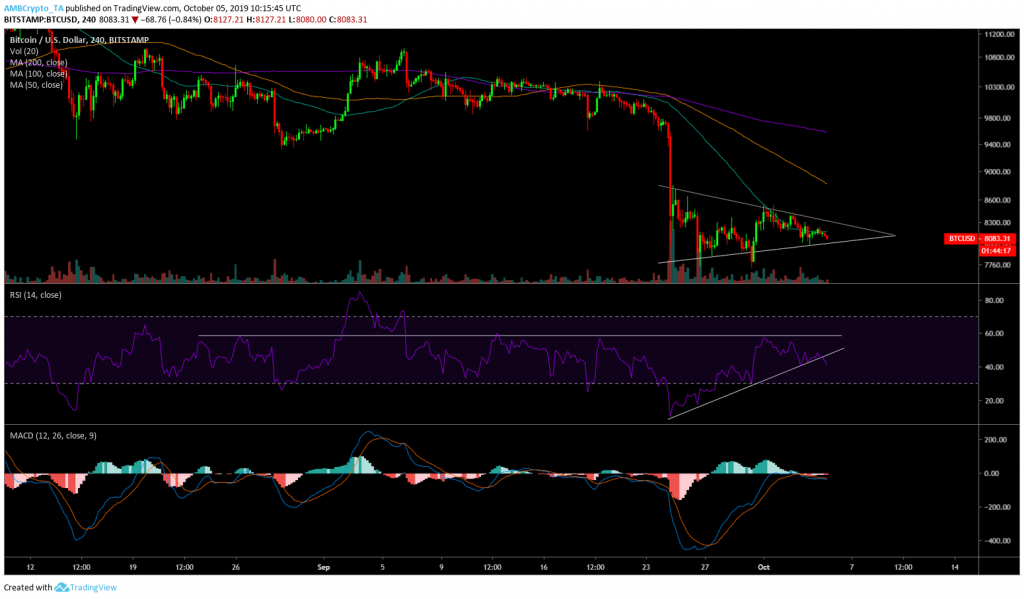
Source: TradingView
The shorter time frame for BTC is already exhibiting bearish signals even during the consolidation phase. The price is moving sideways and in a symmetrical triangle pattern and has come very close to the end of the pattern. Since the pattern is symmetrical the direction of the breakout requires an extra confirmation from other indicators.
Adding to the above is the 50-moving average which has been acting as resistance and the price has respected it, breaching this would mean that the price has two more resistance that needs to be breached, the 100 and the 200.
The Relative Strength Index showed that there might be a divergence happening soon, however, it also indicated that RSI failed to conquer resistance and breached support. The downward travel for RSI would indicate that the price might follow through, even if there is positive breakout for the price from the pattern. Additionally, if the price falls below the oversold zone, it would be another disaster for Bitcoin.
Moreover, MACD indicator also failed to rise above the zero-line further complementing signals indicated by the RSI. The MACD indicator shows that there is a bearish crossover.
One-Day Chart
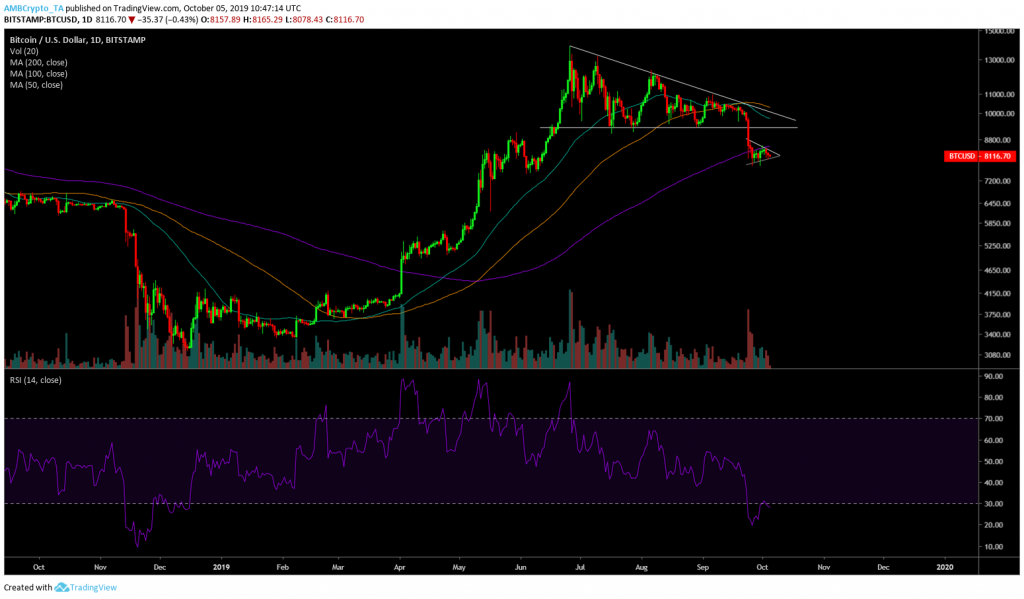
Source: TradingView
The 200-day moving average showed that the narrative for Bitcoin has not turned bullish yet. The times Bitcoin has been above the 200-day moving average were the times Bitcoin rallied; the rest of the times Bitcoin was in a bear market. Bitcoin was below the 200-day moving average since March 2018 and went above it only in April. Since the tables have turned there might be a chance that the bear market never really ended.
Confirming this is the RSI which is still in the oversold zone and seems like it has failed to climb above the oversold zone and is heading back for another dip.
Moreover, the dominance of Bitcoin has also taken a hiatus as it has come down to 69%; looking at all of the above factors, it looks like Bitcoin might take a break from rallying anytime soon.