Bitcoin Cash short-term Price Analysis: 28 September

The price of Bitcoin Cash was flourishing, at the time of writing, with BCH’s price picking up momentum since the 23rd of September. After briefly testing a low of $200, the crypto-asset was quick to recover by $20 within a day. In fact, over the past couple of days, the crypto-asset has consolidated between $235 and $220.
With Bitcoin Cash’s price trending upwards, chances for a re-test at the resistance level of $237 are evident. At press time, Bitcoin Cash had a market cap of $4.28 billion.
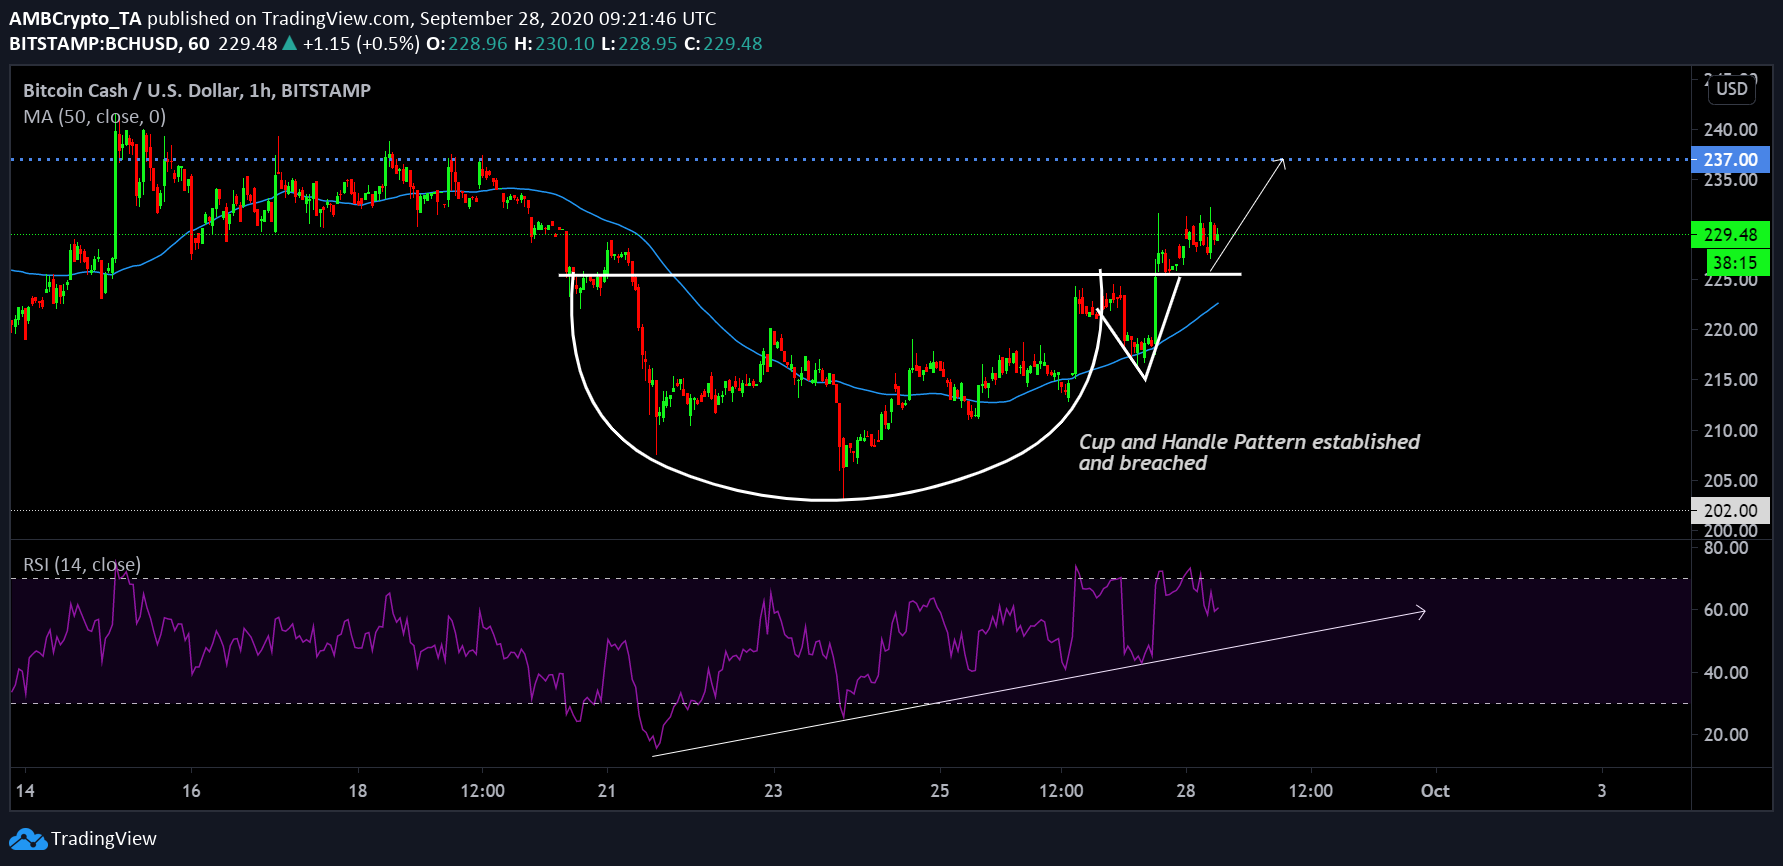
Bitcoin Cash 1-hour chart

Source: BCH/USD on Trading View
For Bitcoin Cash, its latest bullish recovery was supported by a couple of technical patterns over the past few days. After the massive dip on 22nd September, the price managed to stabilize above $200, keeping close proximity to that range for quite a bit of time. However, the price movement over the ensuing week soon led to the formation of a cup and handle pattern. Following the same, the crypto-asset’s value was able to positively breach the neckline at $218.
Another positive indicator was the recovery of buying pressure on the charts. After a massive sell-off during the third week, buyers were able to recoup a better position in terms of dominating the outlook and moving a bullish narrative forward. With the 50-Moving Average underlined as a support level, the price of BCH might continue to climb north.
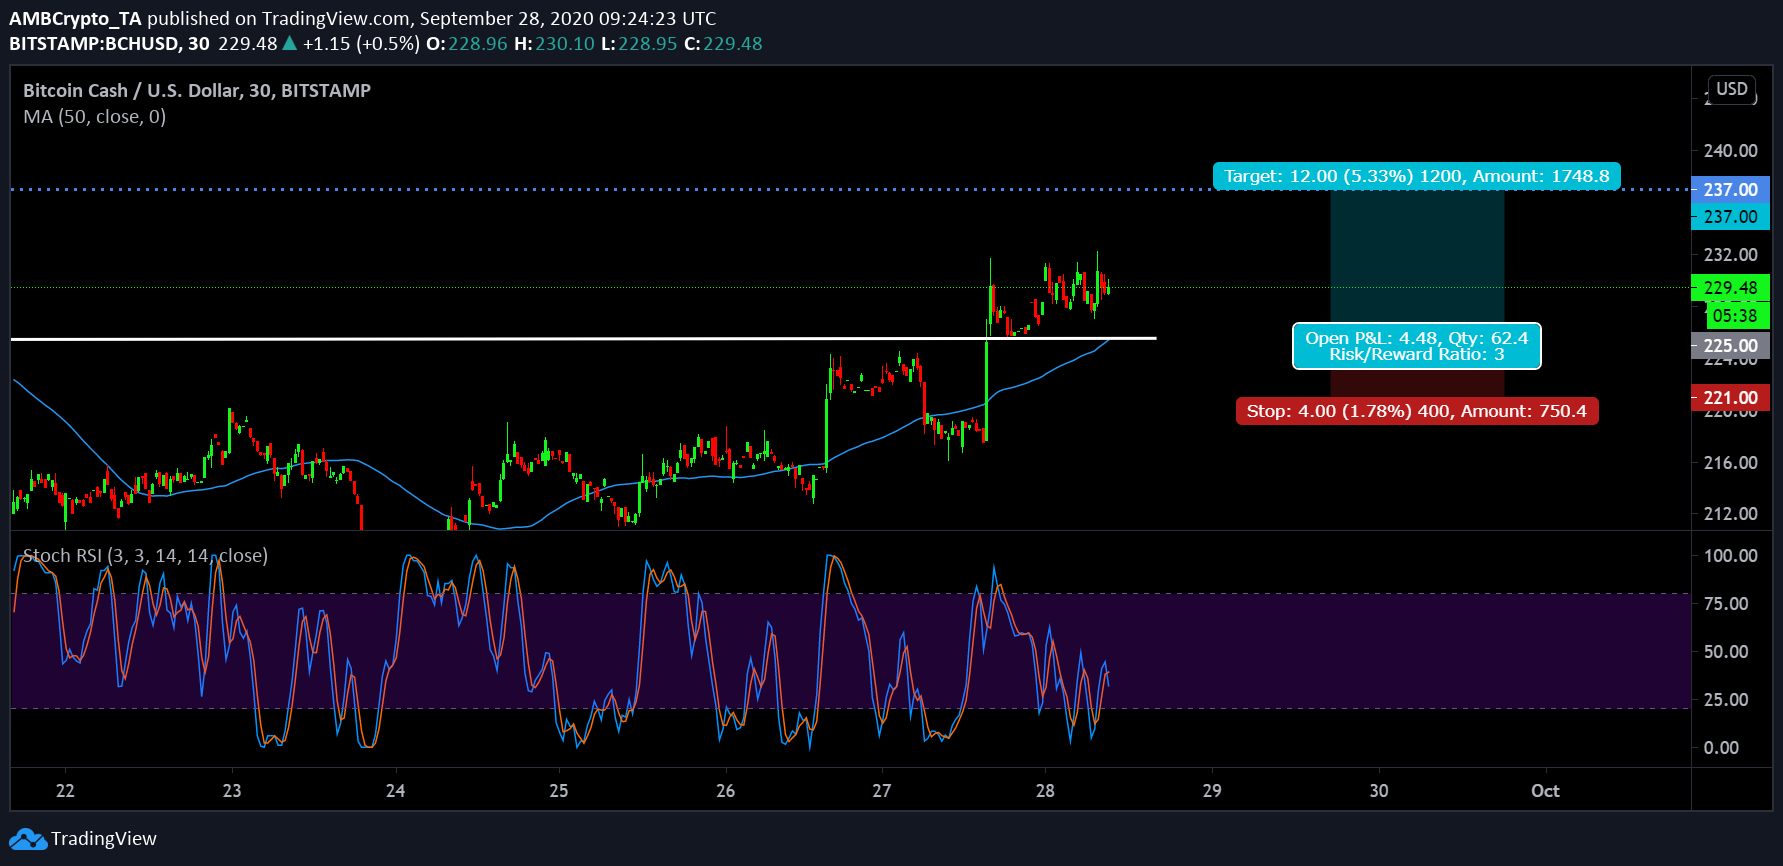
Bitcoin Cash 30-min chart

Source: BCH/USD on TradingView
With the price of Bitcoin Cash lined for a re-test at $237, an entry position should be kept with a little bit of pessimism. The valuation should be pulling back until $225, before pushing for another rally, which should be marked as an entry for a long position. With a stop loss at $221, profits can be taken at $237 as suggested for a Risk/Reward ratio of 3x.
The Stochastic RSI pointed to a minor bearish flip as well, one that is possibly going to take BCH down to $225 in the next few hours.


