Tezos long-term Price Analysis: 26 October

Disclaimer: The findings of the following article are the sole opinion of the writer and should not be considered investment advice
Tezos has struggled to relive itself from the vice grip of the market’s bears, and bullish periods for the token have been few and far between since the 2nd week of August. With a market cap of $1.56 billion, Tezos, at the time of writing, registered a trading volume of $123 million on the charts.
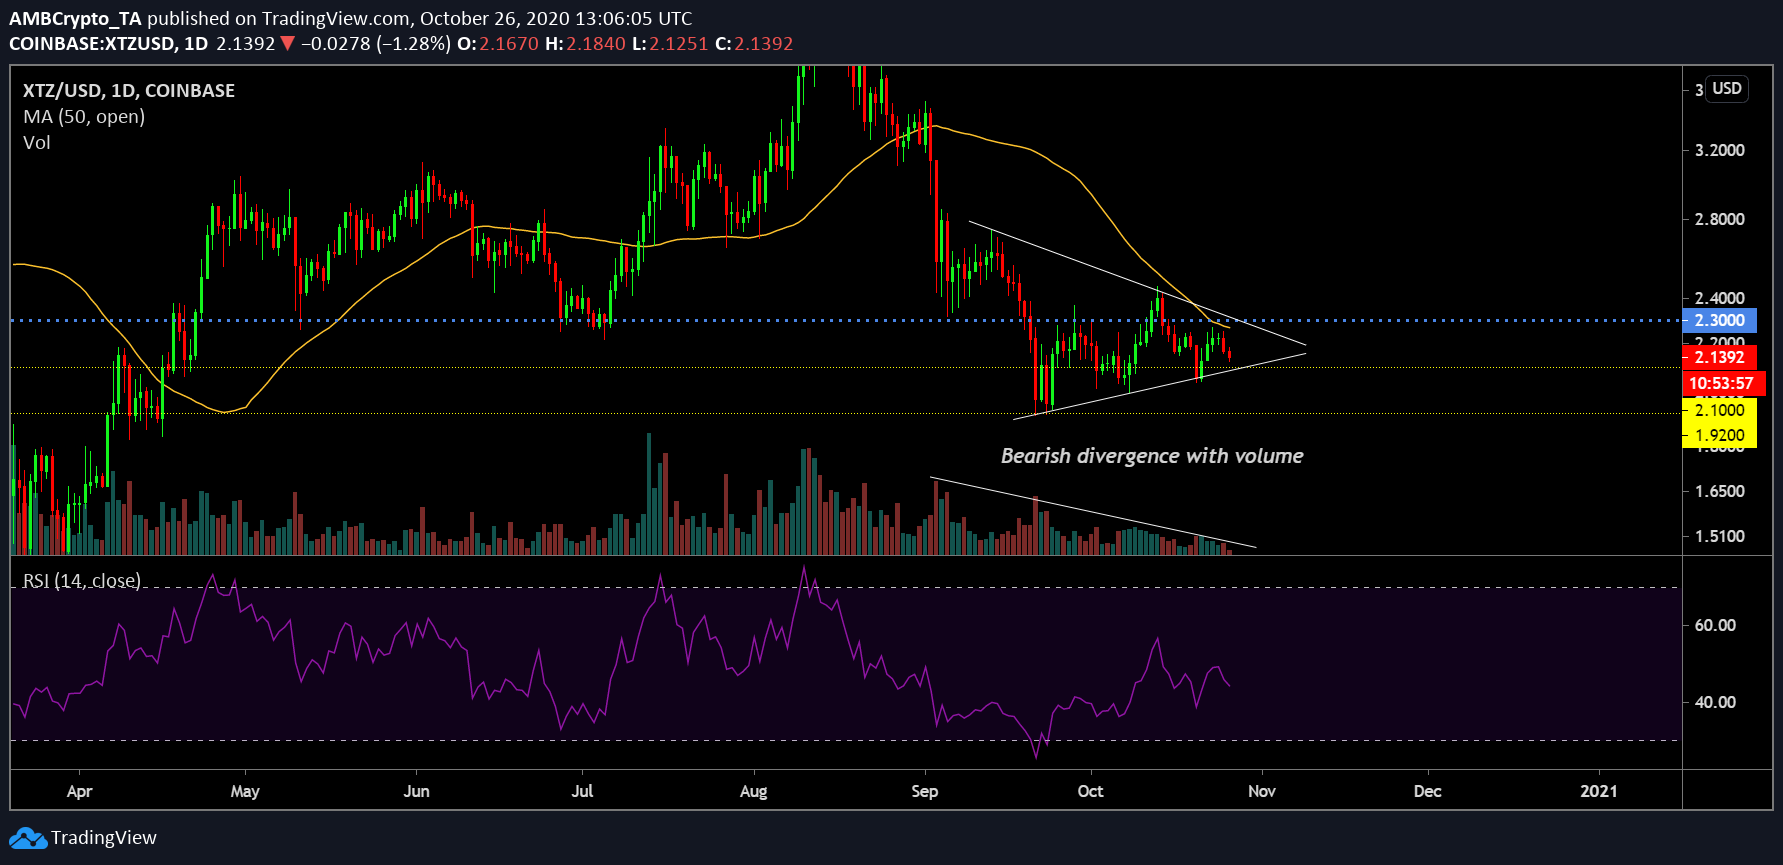
Tezos 1-day chart

Source: XTZ/USD on Trading View
For Tezos, the market has been significantly bearish since August. While the crypto-asset did register its all-time high with a value of $4.9 on 16 August, the decline down to $1.92 has been a difficult one to shake off for Tezos. Ranked 18th on the charts, XTZ’s charts pointed to the formation of a symmetrical triangle, at press time. While a symmetrical triangle might undergo a breakout both ways, the collective market trend was taking a bearish direction, at the time of writing.
In fact, certain signs were evident on the chart as well. The cryptocurrency’s falling trade volume, alongside its improving price, was a clear bearish divergence. Further, the Relative Strength Index or RSI suggested that the valuation was heading towards a selling market. Finally, the 50-Moving Average continued to act as overhead resistance.
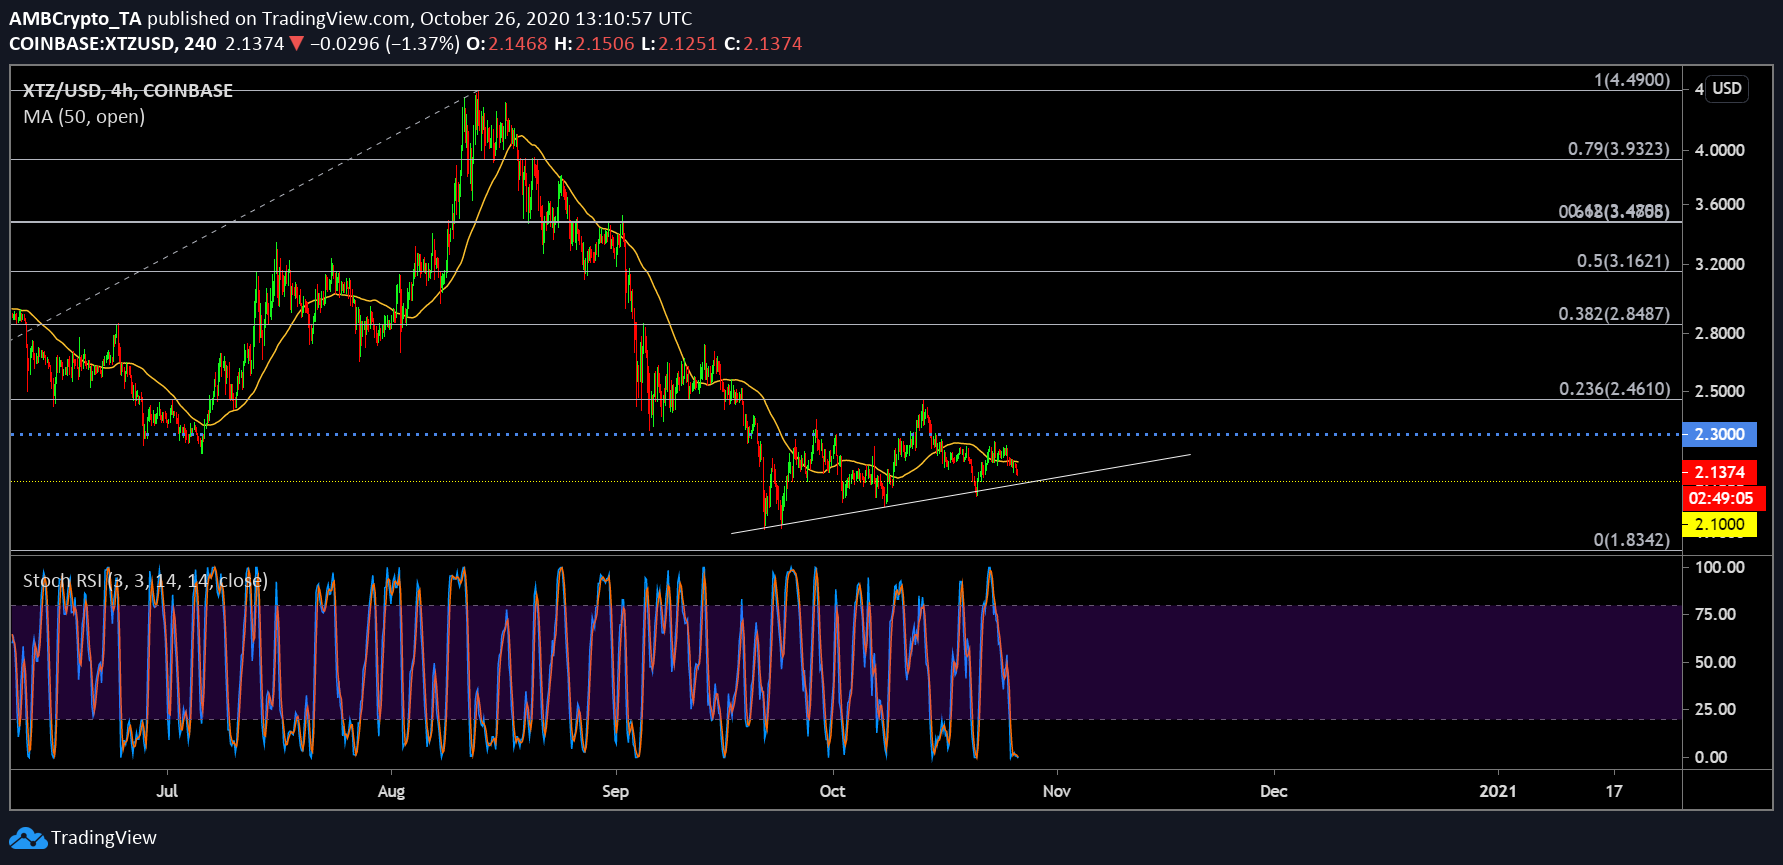
Tezos 4-hour chart

Source: XTZ/USD on TradingView
However, the 4-hour chart noted a peculiar contraction. With XTZ’s price maintaining a strong uptrend since its decline down to $1.92, a bearish breakout was not evident on the 4-hour chart. However, the trigger point could potentially be a retracement to $2.30, before the price collapses for a re-test under the support at $2.10.
On 16 October, XTZ did exhibit a surge up to the 0.236 Fibonacci retracement line, but its inability to breach the resistance was a major struggle. A drop below $2.30 also followed, highlighting the lack of bullish momentum on the charts.
With the Stochastic RSI suggestive of a bullish crossover around the oversold region, the price should attain a re-test at $2.30, before another drop. Sideways movement will likely be the market theme for the present week.


