
Disclaimer: The findings of the following analysis attempt to foresee Bitcoin Cash’s price movements until the last week of July
Bitcoin Cash’s recent price action hasn’t been able to replicate the strong bullish sentiment that was so common in the early weeks of 2020. While BCH has managed to go past its Black Thursday price point, it has failed to remain above the level for long. At the time of writing, Bitcoin Cash was once again trying to breach the levels set right before the market crash on 12 March.
At press time, Bitcoin Cash was being traded at $222.30, with the cryptocurrency having a market cap of $4 billion. Over the past 24 hours, BCH’s price noted a minor gain of 0.16 percent on the charts, having registered a trading volume of $993 million.
Bitcoin Cash 1-day chart
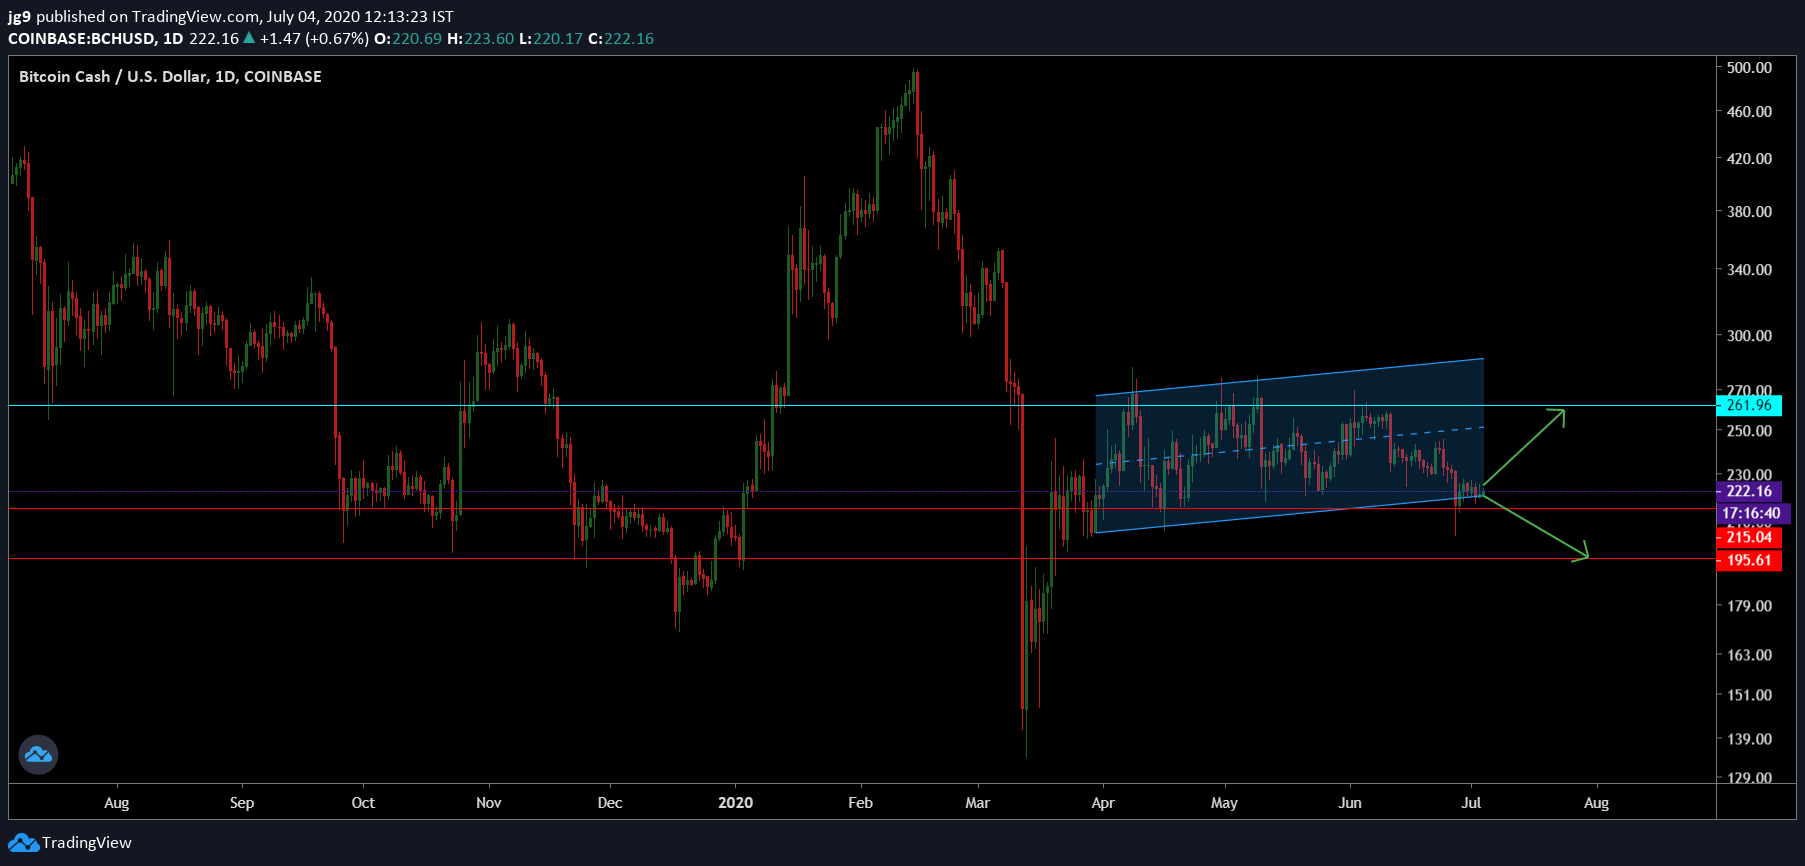
Source: BCH/USD, TradingView
An observation of BCH’s 1-day chart revealed that Bitcoin Cash’s price has been in an ascending channel formation since the end of March, with the crypto now nearing a potential breakout. Whenever the price breaks out of the formation, the price is likely to depreciate and head towards its support level.
Since the price is already close to testing the first support, BCH may see its trading price move towards the second support once the breakout happens and bearish sentiment prevails. However, there is a slightly higher possibility of it moving towards its immediate resistance first in the coming week, while staying within the ascending channel formation.
At press time, Bitcoin Cash had two crucial supports at the price points – $215 and $195, with the immediate resistance for the coin at $261. When the price does break out of the formation, it is likely to head towards Target 1, which is the second support at $195, a development that might come to pass towards the end of July.
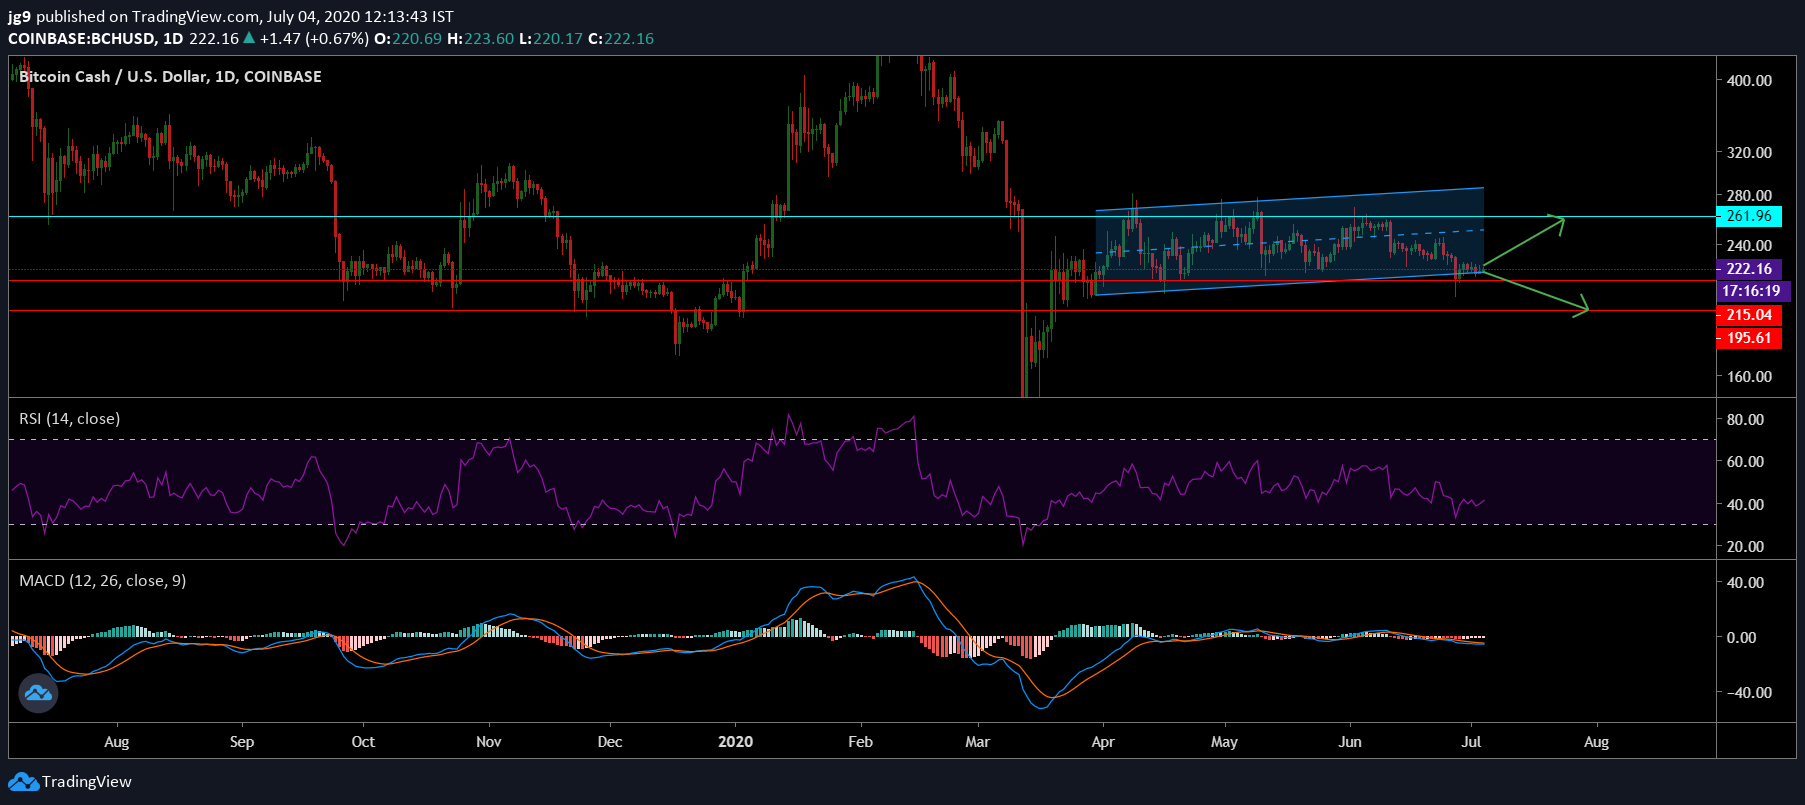
Source: BCH/USD, TradingView
According to Bitcoin Cash’s daily charts, the MACD indicator had recently undergone a bearish crossover, with the signal line going past the MACD line. The Relative Strength Indicator, on the other hand, was heading towards the overbought zone and was showing some signs of divergence.
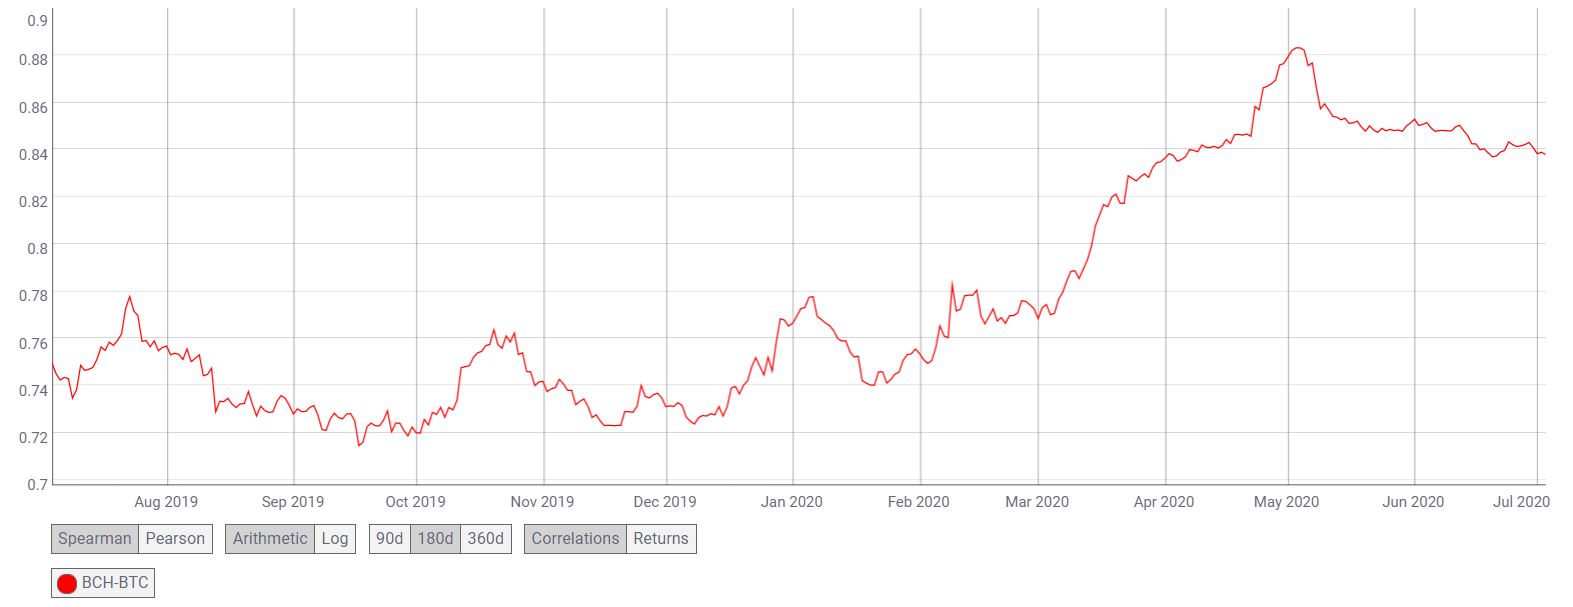
Source: CoinMetrics
Bitcoin Cash’s correlation with Bitcoin continued to remain strong, with the same on a steady upward trajectory for a year now, rising from 0.74 to 0.83 and signaling that the price of BCH may be influenced by the king coin’s price action.
Conclusion
Bitcoin Cash has been in an ascending channel formation for a considerable period of time and the price breakout is likely to happen towards the end of July. Taking into account the indicators and the probable price breakout, a minor surge may see it rise within the formation and moves towards the resistance at $261. However, in the long term, BCH’s price may dip towards the $195-range.