Litecoin long-term Price Analysis: 13 June

Disclaimer: This analysis will be attempting to foresee changes in Litecoin’s price charts until the final week of June
Following the unexpected market crash in March, Bitcoin was resilient enough to claw back to its yearly high of $10,400, albeit briefly. Alas, Litecoin hasn’t noted the same level of tenacity, with LTC continuing to consolidate way below its yearly-high of $84. It would seem now that the situation hasn’t improved much for Litecoin yet, and a continued struggle was evident in light of the bearish pressure on the charts.
Litecoin 1-day chart

Source: LTC/USD on TradingView
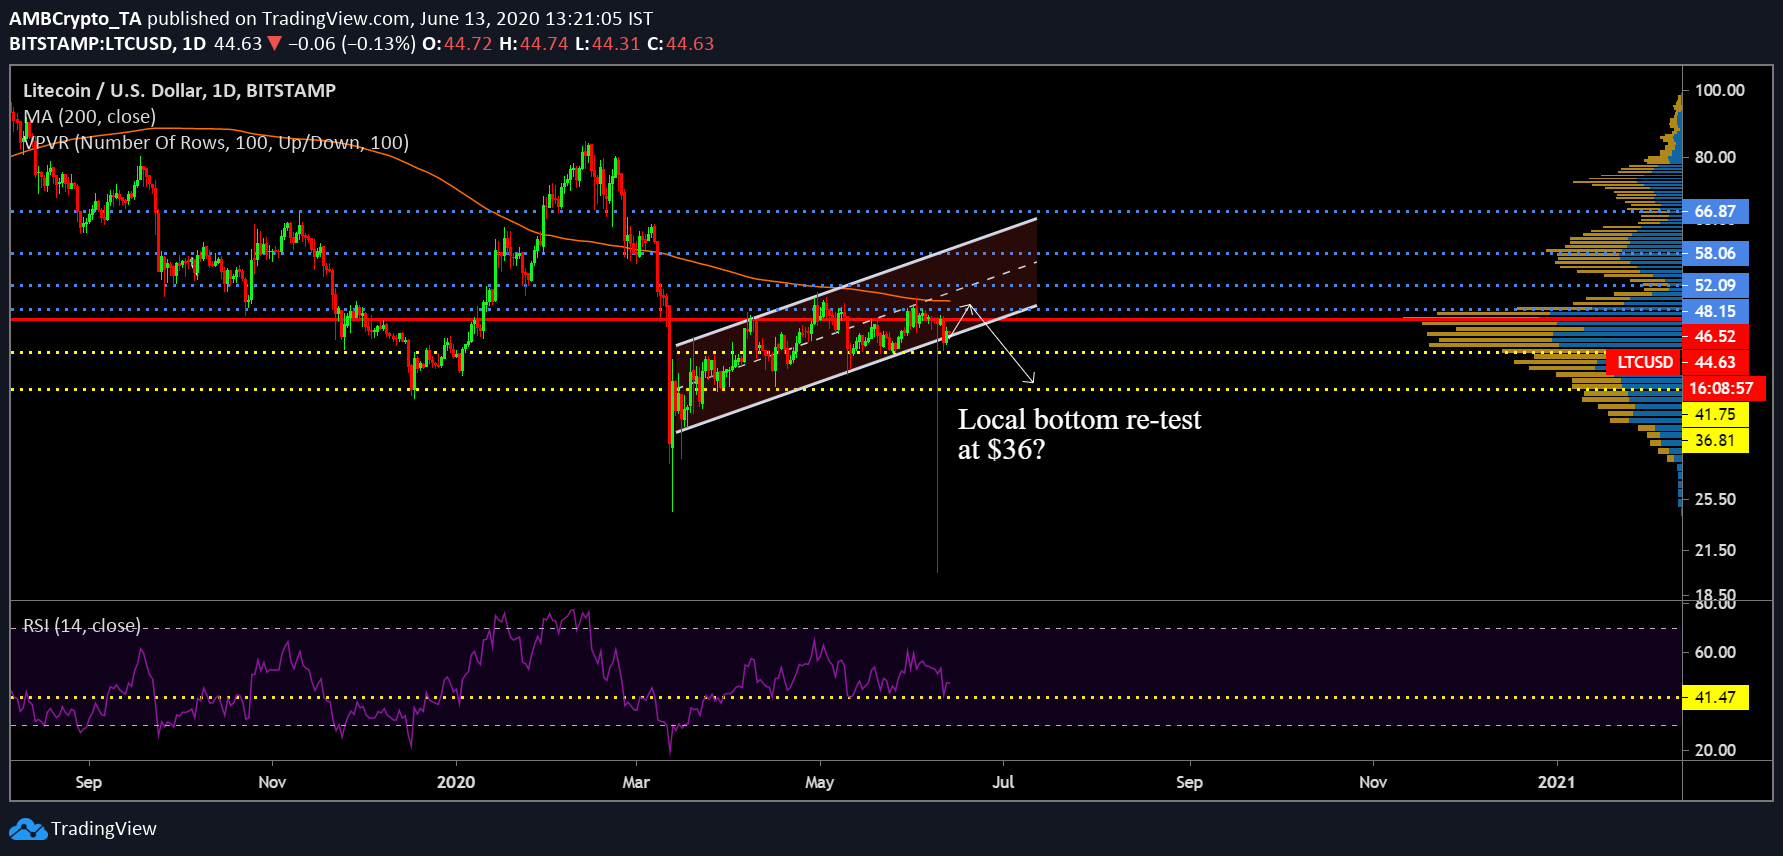
As illustrated by the charts, the key problem with Litecoin’s bullish narrative has been its inability to surge over its 200-Moving Average (Orange line). On the contrary, both Bitcoin and Ethereum have managed to sustain a positive trend above their Moving Averages on the charts over the past few weeks.
At the time of writing, Litecoin’s price continued to move within the trendlines of an ascending channel. At first glance, a bearish breakout seemed imminent as the price was consistently moving under the average line of the channel pattern.
Considering the possibility of a bearish breakout panning out, LTC might potentially drop below its support at $41-$40, a range held since the start of May. A quick surge to the resistance level at $48 might surface over the next two weeks, but it is unlikely to breach the target. Strong supports below $40 remained at $36, a level that might be the probable position by mid-July.
At the time of writing, the Relative Strength Index or RSI was noting a glimmer of hope as the buying pressure kept the rating above 41. However, any move below the aforementioned mark will possibly trigger the drop-down to $36.
Litecoin 1-day chart

Source: LTC/USD on Trading View
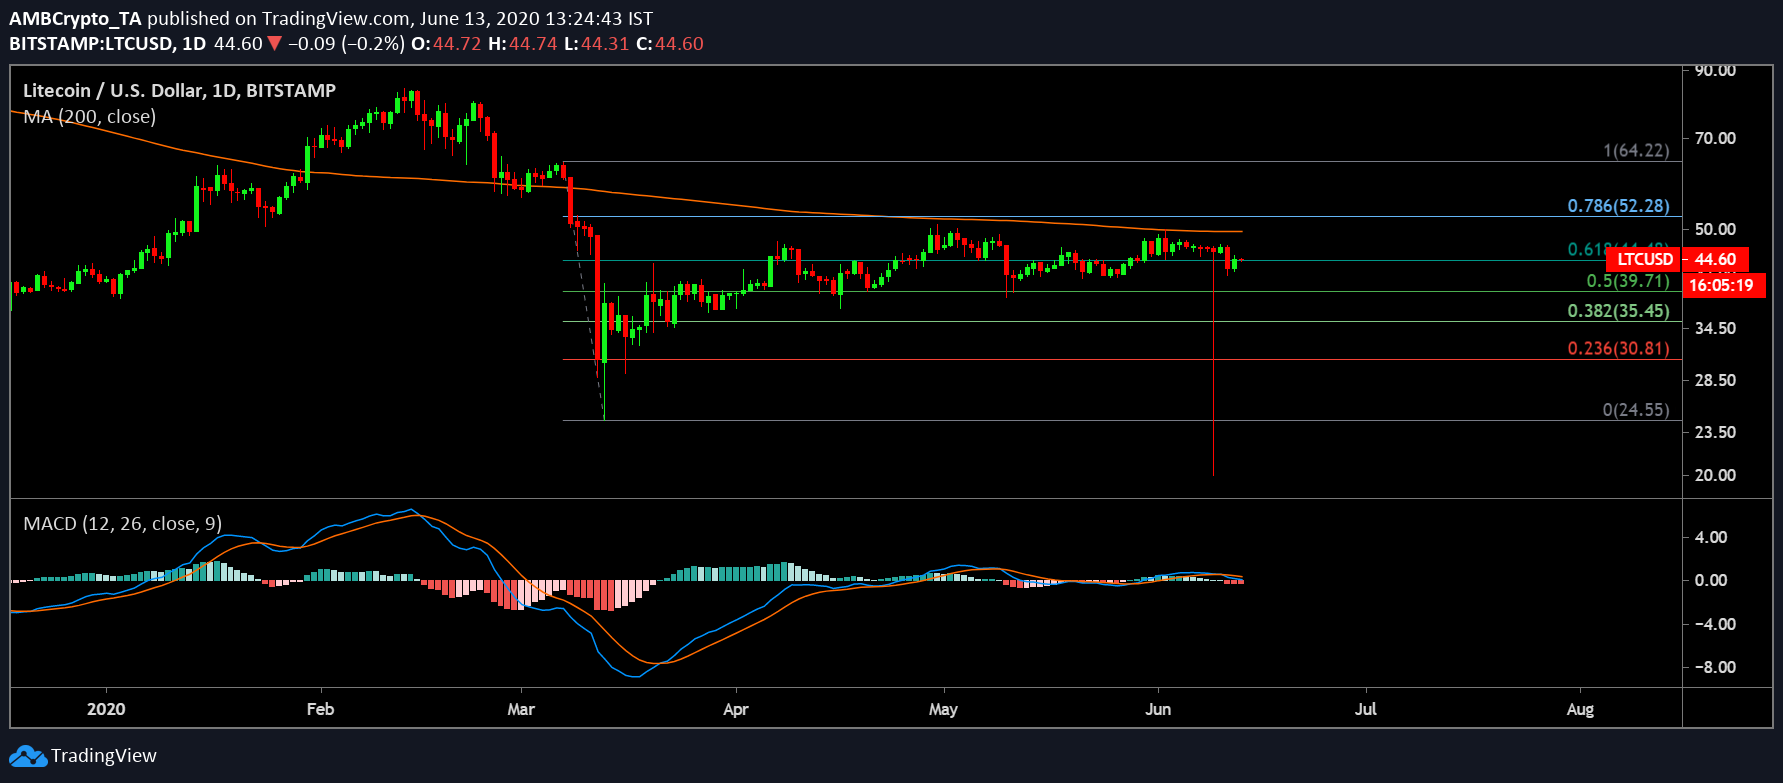
With respect to the Fibonacci Retracement, Litecoin has been treading close to the 0.618 lines at $44 since the end of April. However, considering a drop was, at press time, expected, a position below 0.5 ($39) could surface by the end of June 2020. A further pullback will eventually bring the crypto-asset near 0.382.
Further, the bearish nature noted by MACD, as the red line hovered over the blue line, had the potential to dampen some of the optimism in the market.
Conclusion
Litecoin will possibly drop down to $40 by 24th-29th June. Further bearish pressure will take the valuation close to $36 by mid-July.


