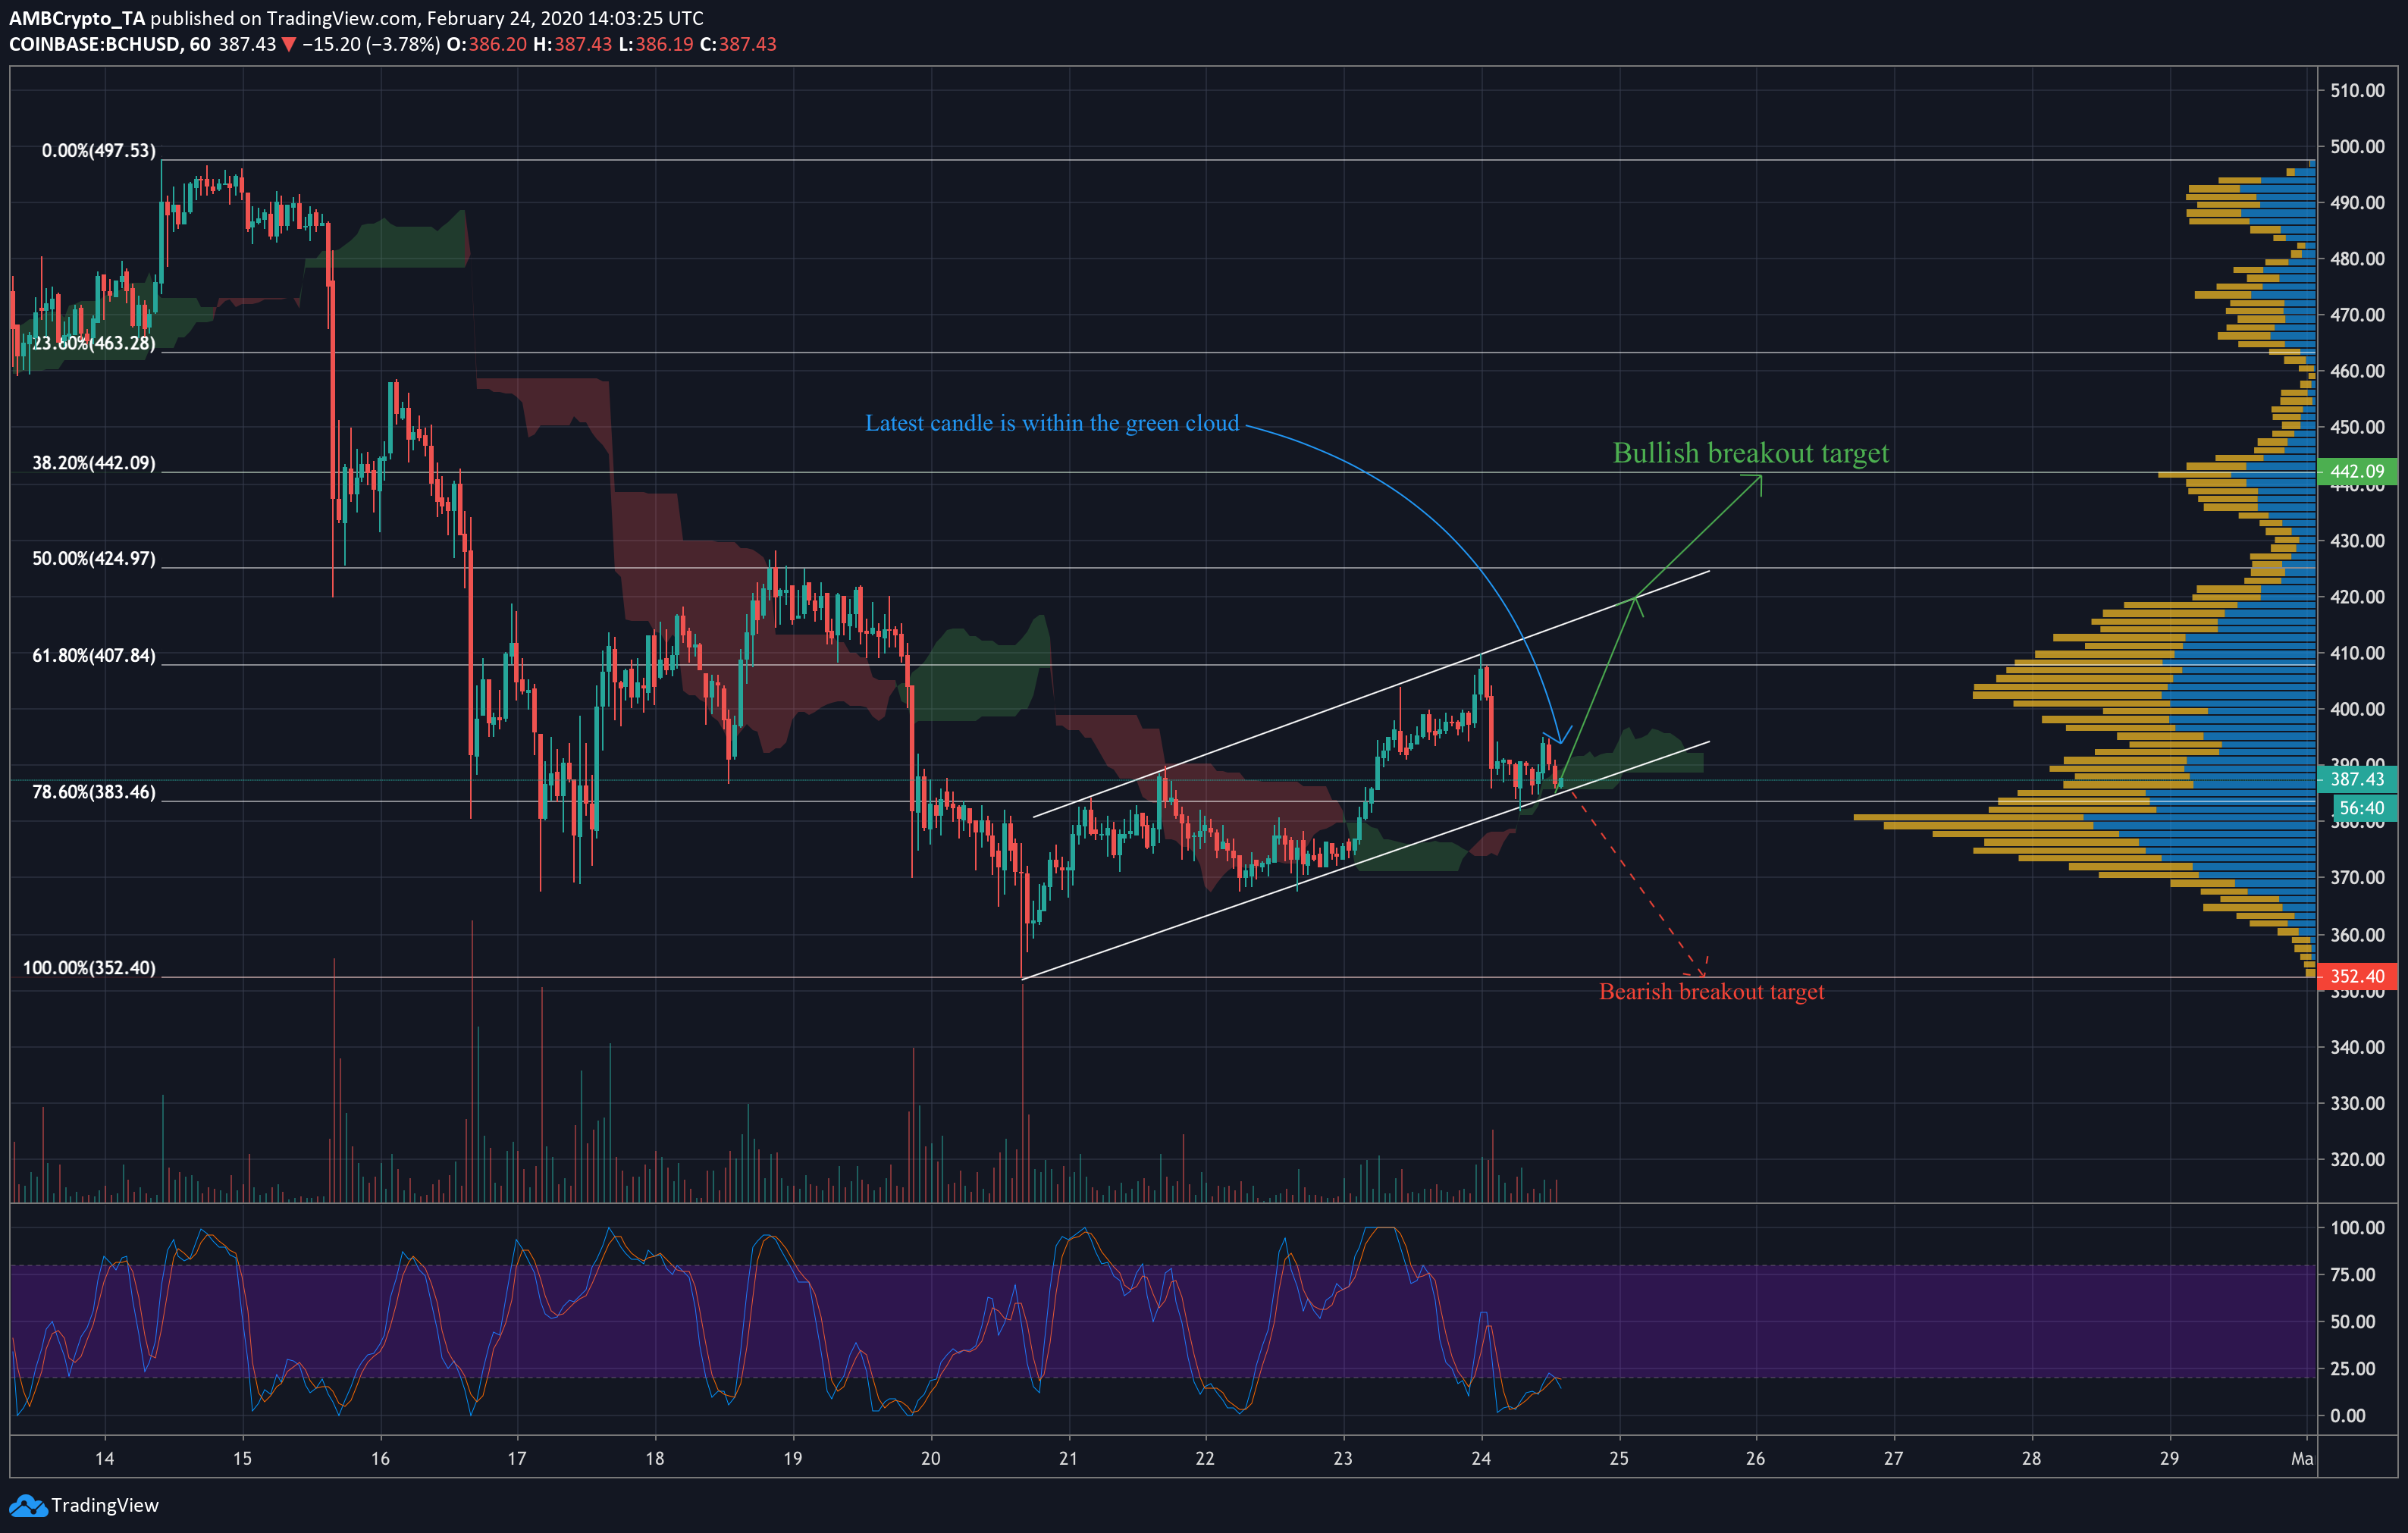
Bitcoin Cash could shoot to $442 or dip to $352 over the next week

After touching nearly $500 in mid-February, Bitcoin Cash steadily made its way to the $370 level over the week that followed. Since then, members of the community have been eagerly anticipating a revisit of the $425 level, something that could happen in the next few days. However, a far more devastating dip could be in store as well.
According to CoinMarketCap, Bitcoin Cash had a market capitalization of over $7.1 billion, at press time, and was recording a 1.89% drop over the last 24-hours.

Source: Coinstats
Bitcoin Cash 1-hour chart

Source: BCH/USD on TradingView
Bitcoin Cash appeared to have been moving through an ascending channel over the last few days. These patterns have an equal chance of bullish and bearish breakout outcomes, though an upward movement seems likely in the current scenario.
At the time of analysis, BCH’s price was testing the pattern’s lower boundary, which could either result in a downward-facing breakout or a bounce-back to the upper trend line.
The Ichimoku Clouds indicator predicts potential price movements using moving averages at different intervals. Generally, green clouds under the price indicate price appreciation in the short-term. However, since the latest price candle was moving inside the cloud, some sideways movement might occur over the next couple of days.
The Stochastic RSI indicator had attempted to move back into the stable zone, but had later dipped back under, at the time of writing. The faster moving average had also crossed above the slower moving average, which is usually a sign of some bearish movement in the near future.
If Bitcoin Cash is able to push above the Ichimoku Cloud, the coin might see a rise to the upper trend line at $420 in the next week or so. This could facilitate a breakout to the next high volume node above the pattern, at the 38.2% Fibonacci retracement line ($442). However, if BCH dips lower, it could move down to the high volume node beneath the pattern, at $380, before falling to the 100% retracement line at $352 in around the same amount of time.
Volatility

Source: CoinMetrics
According to CoinMetrics, Bitcoin Cash’s 60-day volatility has been steadily rising since mid-January, after a sudden spike toward the start of the year. Heightened volatility could strengthen BCH’s price movements in the coming days. However, volatility can mean downward movements too and could result in a bearish breakout in the short-term.
Conclusion
If Bitcoin Cash manages to push above the Ichimoku Clouds, BCH could push above the pattern’s upper boundary and break out to the $442 level in the next week or so. However, if bearish pressure causes the price to break under the pattern, Bitcoin Cash could be in for a devastating drop to the $352 level over the same period of time.


