XRP user devices solution for identifying ‘net’ liquidity of coin

Ripple and XRP have carved a niche in the traditional financial sector, with many institutions including banks showing a keen interest in using ODL platform. With Ripple introducing new corridors in Australia and soon will be opening a gateway to Brazil, the need for liquidity data becomes vital.
Twitter user @tenitoshi, who actively shares details about XRP liquidity in various corridors, devised a solution for assessing the “net” liquidity of the digital asset. According to the data curated by the Twitter user, XRP liquidity saw a surge in August 2018, when the speculations of institutional investors on-boarding were strong.
@tenitoshi tweeted:
I've developed a new index to monitor market liquidity instead of simple “trade volume”. It enables us to assess “net” liquidity provision. With this index, I found a jump on XRP liquidity growth at Aug 2018. Might be consistent with the Q3 XRP report: Institutional Investors. ? pic.twitter.com/fp1YKTYZIo
— てにったー (@tenitoshi) November 22, 2018
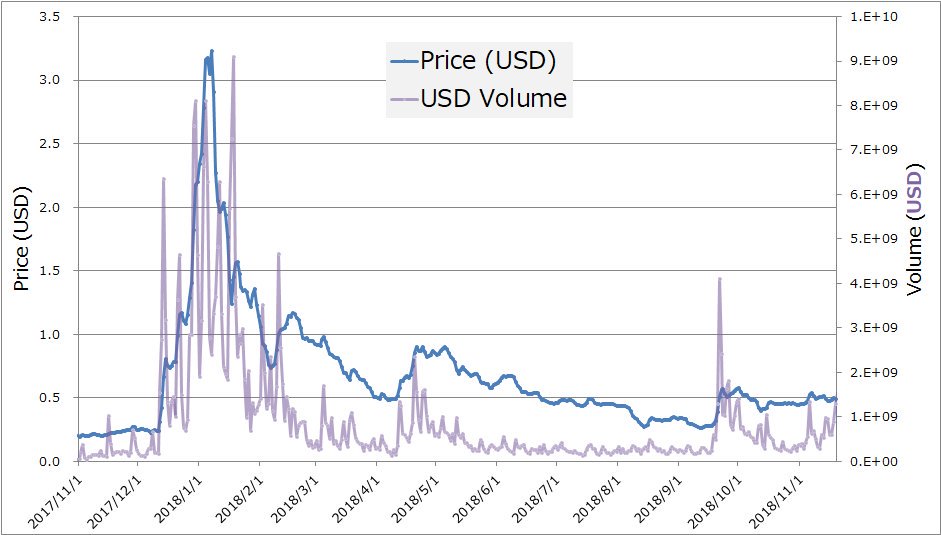
According to the user, the data based on the trading volume of the coin provided insufficient information about its liquidity. The August 2018 hike was nearly invisible in the trading volume chart below.

Source: Twitter, @tenitoshi
The Twitter user noted that the market liquidity played a key role in XRP adoption as a bridge asset, due to its ability to facilitate currency conversions. @tenitoshi further explained:
“Traditionally “trading volume” has been used to assess liquidity. However it does not seem to work well especially for crypto markets.”
Due to the impact price appreciation and volatility have on trading volume, liquidity remained dormant in the chart. While the user’s liquidity index extracted components of essential liquidity by makers and takers, based on trade volume. The user explained his methodology in a tweet:
This method is based on an empirical assumption that trade volume can be expressed in terms of a function with variables:
① Market price of asset
② Sudden (short-lived) volume increase in response to pump & dump
③ Base volume independent from market environment like ① and ②— てにったー (@tenitoshi) November 22, 2018
Tenitoshi’s index aimed to measure base volume or to put it in his terms, “net liquidity” tied to essential liquidity that Ripple has been targeting. This could be used as an aid to measure the total XRP liquidity, especially with the low volatility of the XRP digital currency. The major challenge, according to Tenitoshi, was to eliminate spikes that appeared due to pump-and-dump schemes in the market to point at the base volume.
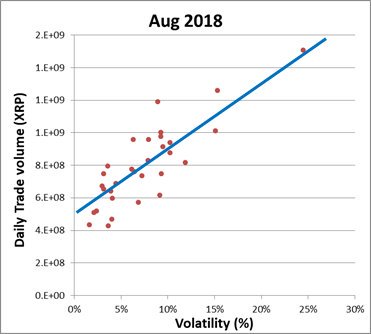
Assuming the existence of base volume independent from market environments, we can build a simple model about volatility (%) vs trade volume. Gross trade volume (blue line) increases with a rise of volatility, which starts from the base volume (green arrow) at zero volatility. pic.twitter.com/9NTheFYBf0
— てにったー (@tenitoshi) November 22, 2018
The model agreed with the actual data, which plotted the daily volume v. volatility data from August 2018.
“By fitting the data points with linear function, we can obtain its Y-intercept, which corresponds to the base volume (③)!”

Source: Twitter, @tenitoshi


