
Bitcoin’s dominance was holding steady at the time of writing, with the same noting a figure of 62.92%. While the altcoin market appeared to be recovering from the recent price shock, some of these cryptocurrencies could record further losses on the charts.
Tron, for instance, formed a bearish flag while Ontology was in a short-term consolidation phase with lowered volatility. Finally, FTX Token was likely to flip a level of resistance to support.
Tron [TRX]
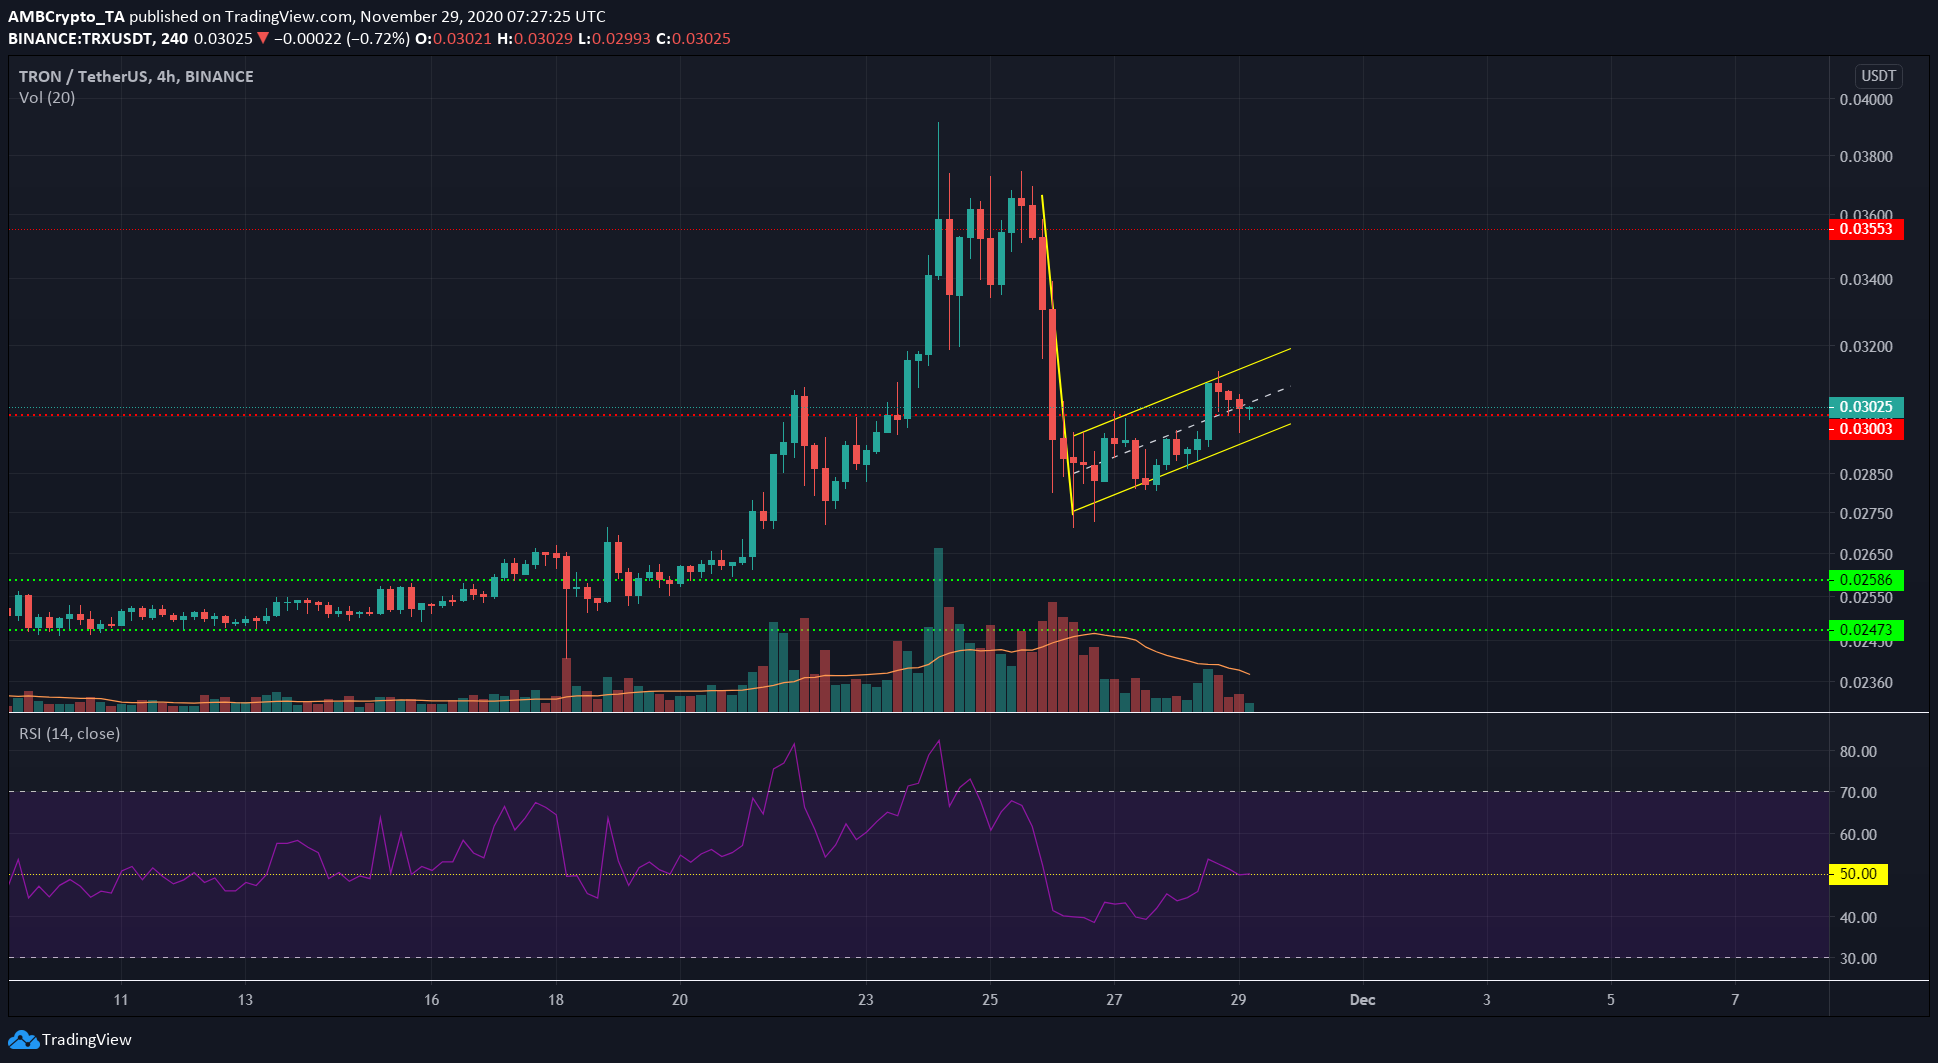
Source: TRX/USDT on TradingView
TRX formed a bear flag on the 4-hour chart. At the time of writing, its price was in an ascending channel, the flag of the pattern. The trading volume has been somewhat low, however.
With a strong level of support at $0.03, it remained to be seen if the pattern will play out. The RSI was at a neutral 50, and by itself, indicated neither momentum nor a trend for TRX.
A close below the $0.03-support level on appreciable volume could see TRX visit $0.025 in the coming days. On the contrary, a rise above $0.0316 would invalidate the bear flag.
Ontology [ONT]
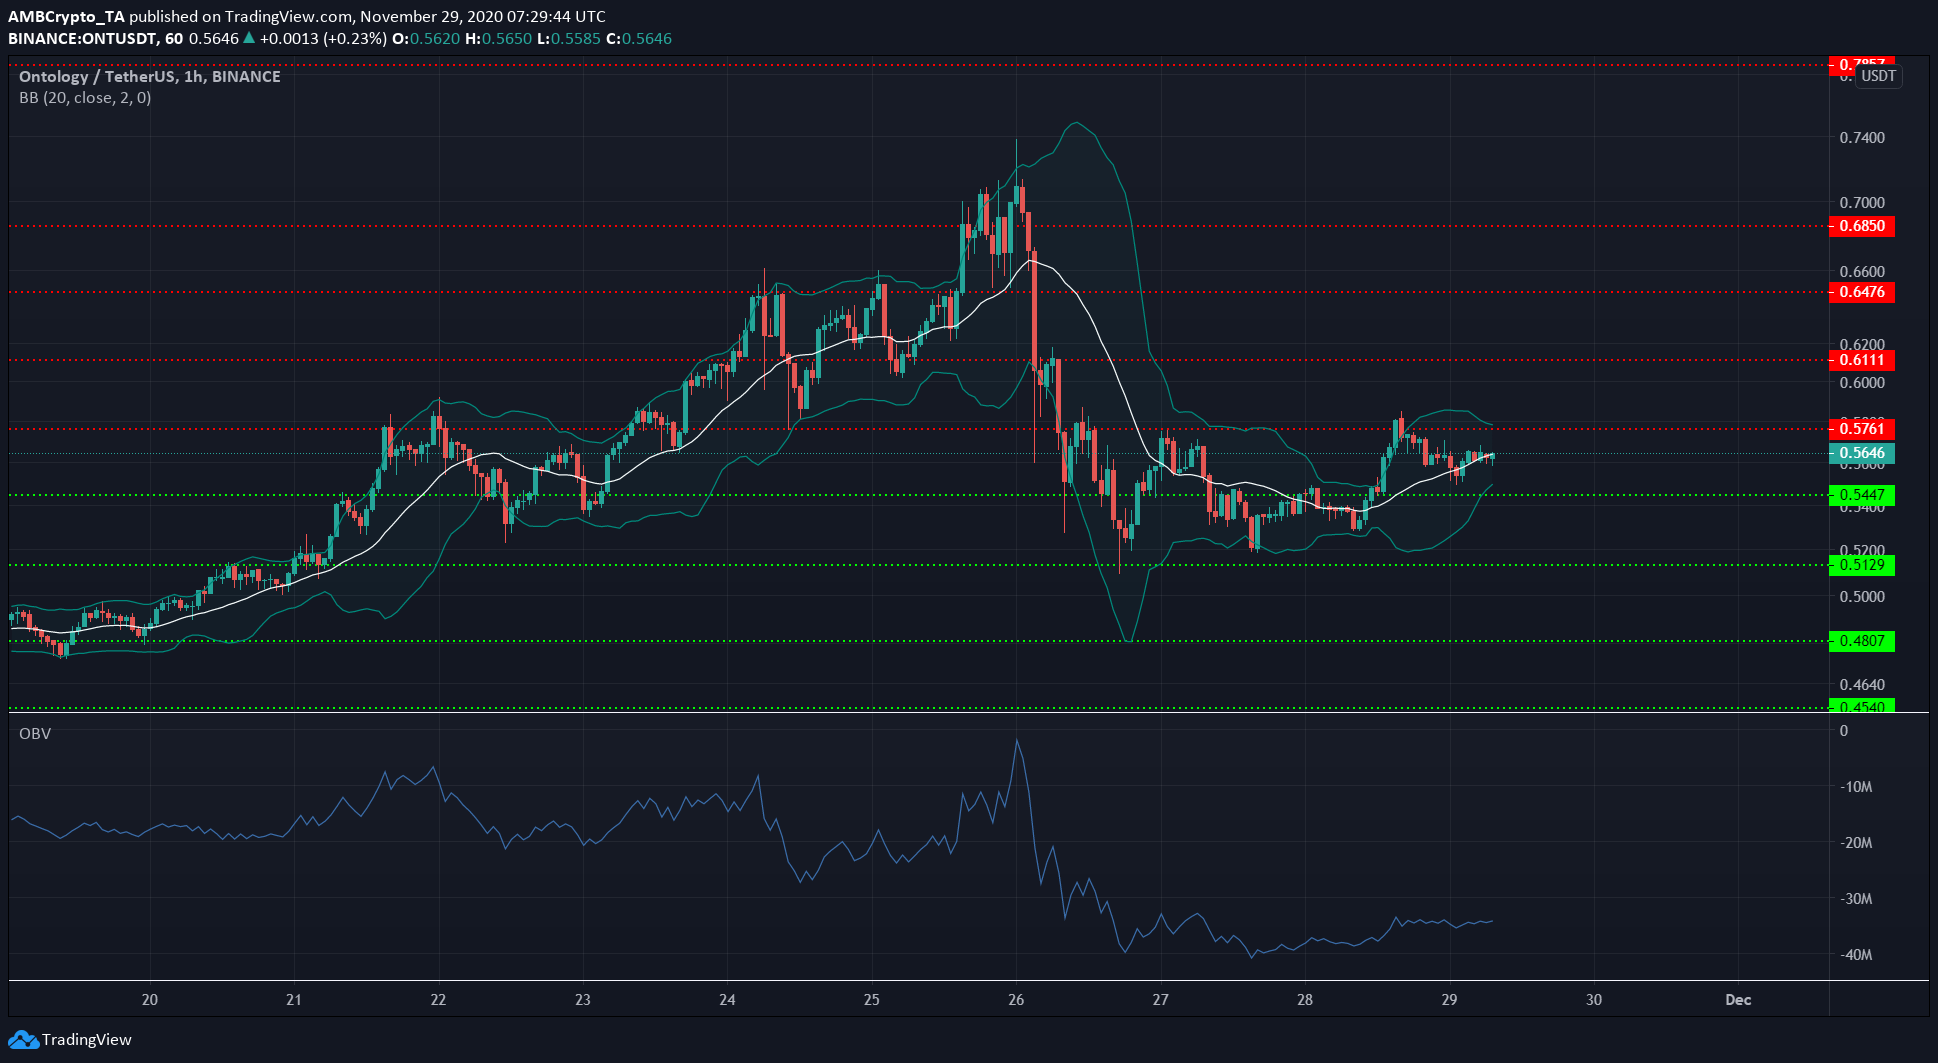
Source: ONT/USDT on TradingView
On the hourly chart, ONT noted brief moments of suppressed volatility. And yet, even as the price crossed above and below the $0.54-level over the past few days, there was no significant buying or selling volume.
The OBV was relatively flat over the past couple of days. The price was trading above the 20 SMA (white), but a lack of buying or selling volume would see ONT trade sideways in the coming days, under the resistance at $0.57, but above the $0.52 region of demand.
FTX Token [FTT]
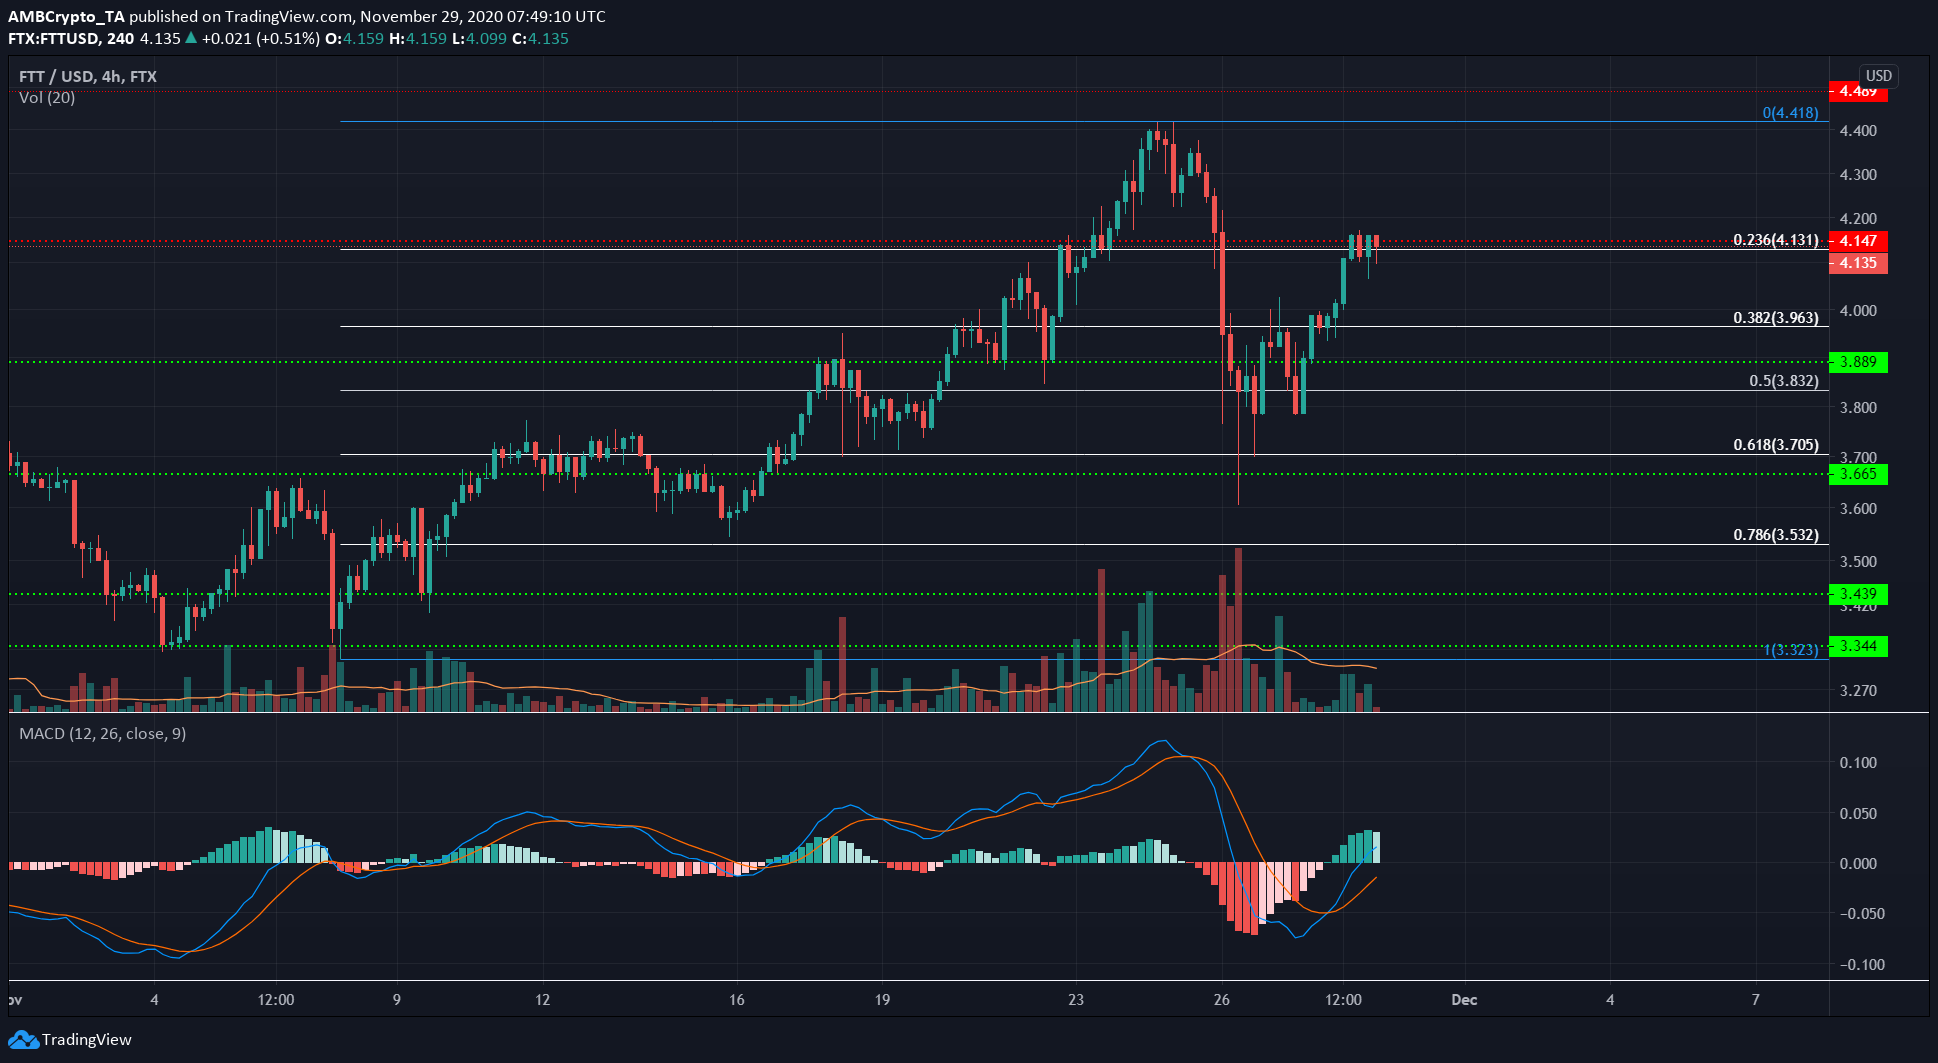
Source: FTT/USD on TradingView
Using the Fibonacci retracement levels for FTT’s move upwards from $3.32 to $4.41, some levels of support and resistance were identified. Used in conjunction with horizontal, historic levels, some confluence was observed.
The level at $4.14 was a strong resistance level, with both a horizontal as well as the 23.6% retracement level in its proximity. However, the MACD had formed a bullish crossover, while also having risen above zero.
A close above $4.14 could see the level being flipped to support, while failure could see FTT seek support around $3.96 or even $3.88.
The gains were made on sessions with close to average trading volume, and it appeared that FTT was likely to flip $4.14 to support in the coming hours.