Tron’s charts saw the market’s bears dominate the proceedings over the past few days, while it also faced controversy over the launch of JustLink. DigiByte and Ontology noted a feeble bounce on the charts, a bounce that could reverse itself over the next few hours.
Tron [TRX]
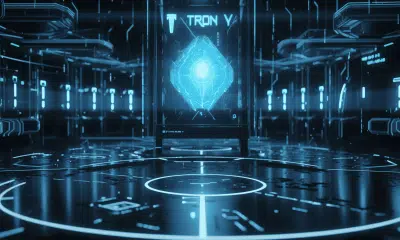
Source: TRX/USDT on TradingView
TRX closed under a rectangle pattern and also saw the level at $0.0258 flipped from support to resistance. The next level of interest for TRX lay at $0.0247, a level where it can expect to find some demand.
The OBV also showed that buying volume was trending lower as it registered a series of lower highs on the charts. The lack of buyer interest could spell another drop for TRX.
Tron was in the news recently when it launched its oracle JustLink, claiming it to be the blockchain’s first and official oracle platform. However, it came under criticism almost immediately as Bridge Oracle executives complained that JustLink “stole all aspects” of their project and implemented it for Tron.
Ontology [ONT]
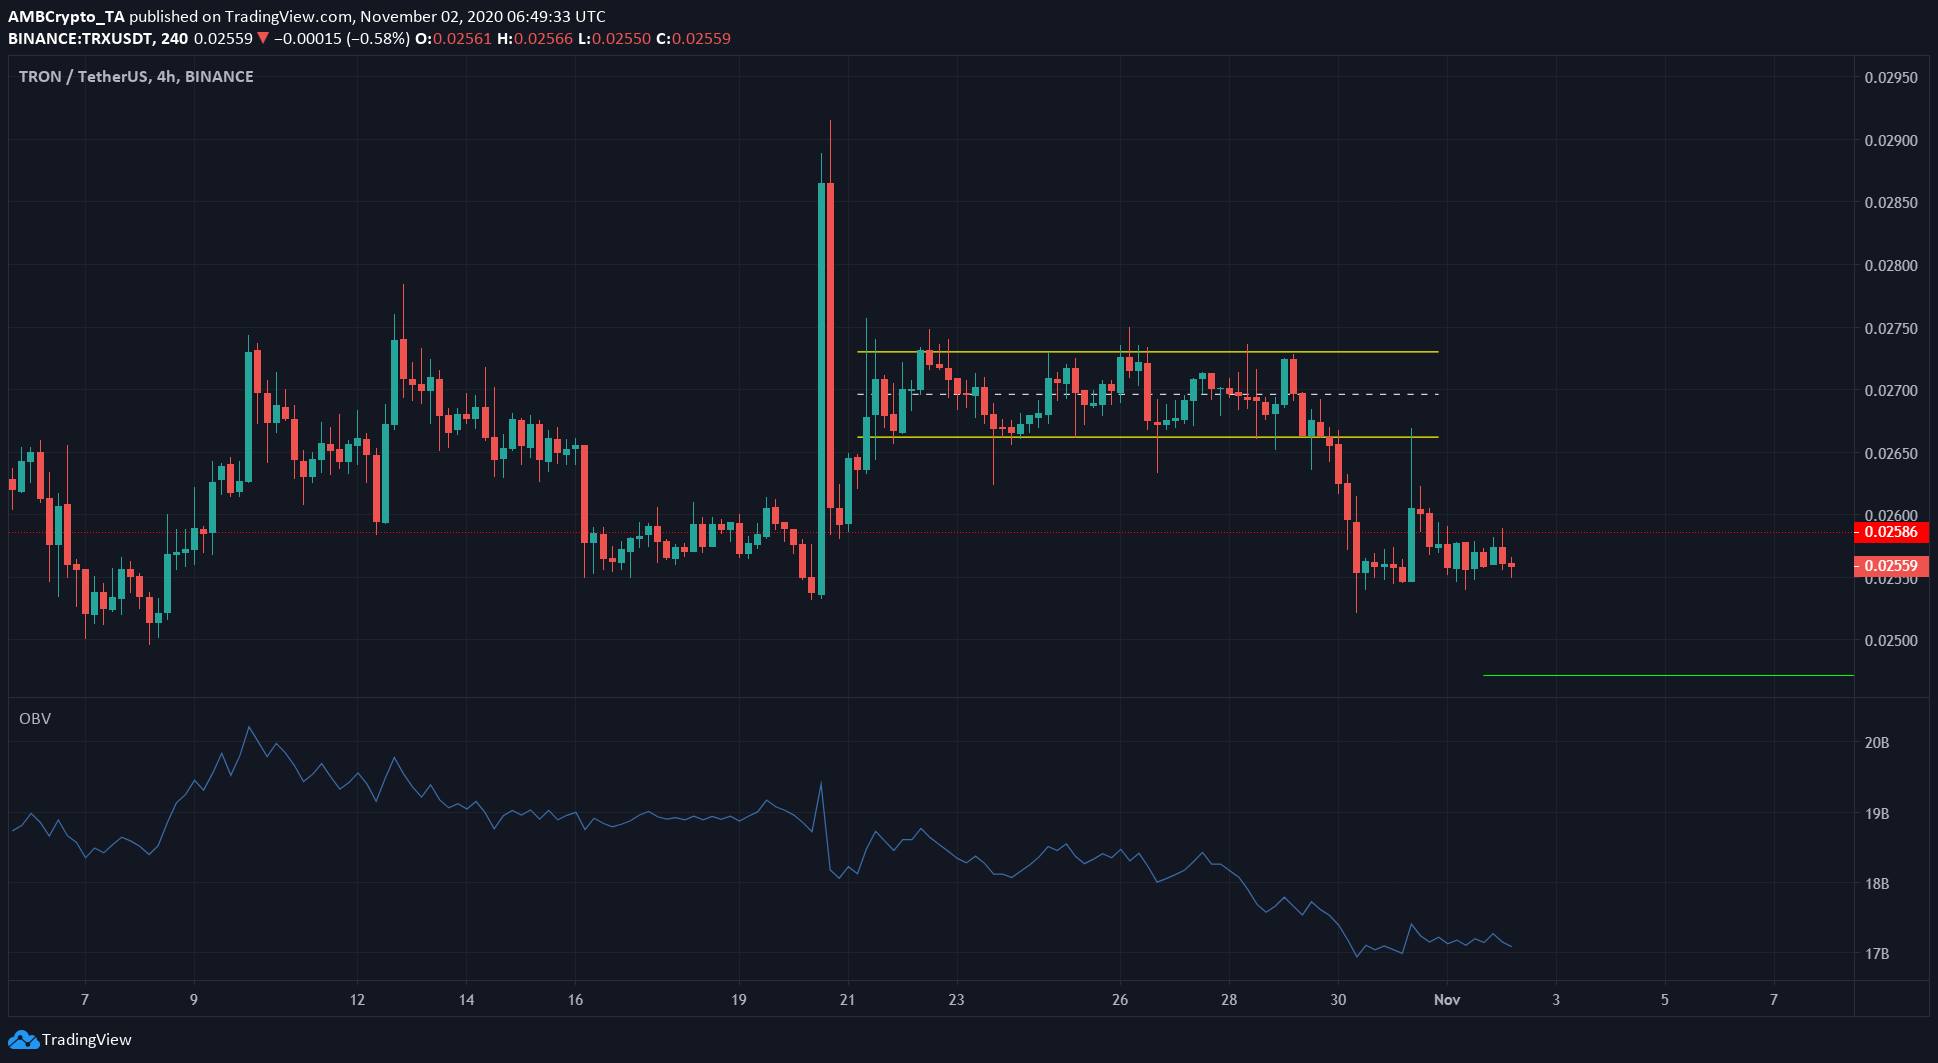
Source: ONT/USDT on TradingView
Ontology dropped sharply under the support at $0.54 to $0.42, before seeing a bounce upwards. The MACD also signaled weak bullish momentum in the short-term as it formed a bullish crossover, but under zero.
ONT will face resistance from $0.48, with the next level of interest being $0.54 for bulls to reclaim to begin recovery. If ONT were to face further losses, the next level of support lay at $0.395.
However, the trading volume over the past few sessions when gains were posted were, for the most part, quite low. This suggested that ONT might move a little higher before the market faces another wave of selling pressure.
DigiByte [DGB]
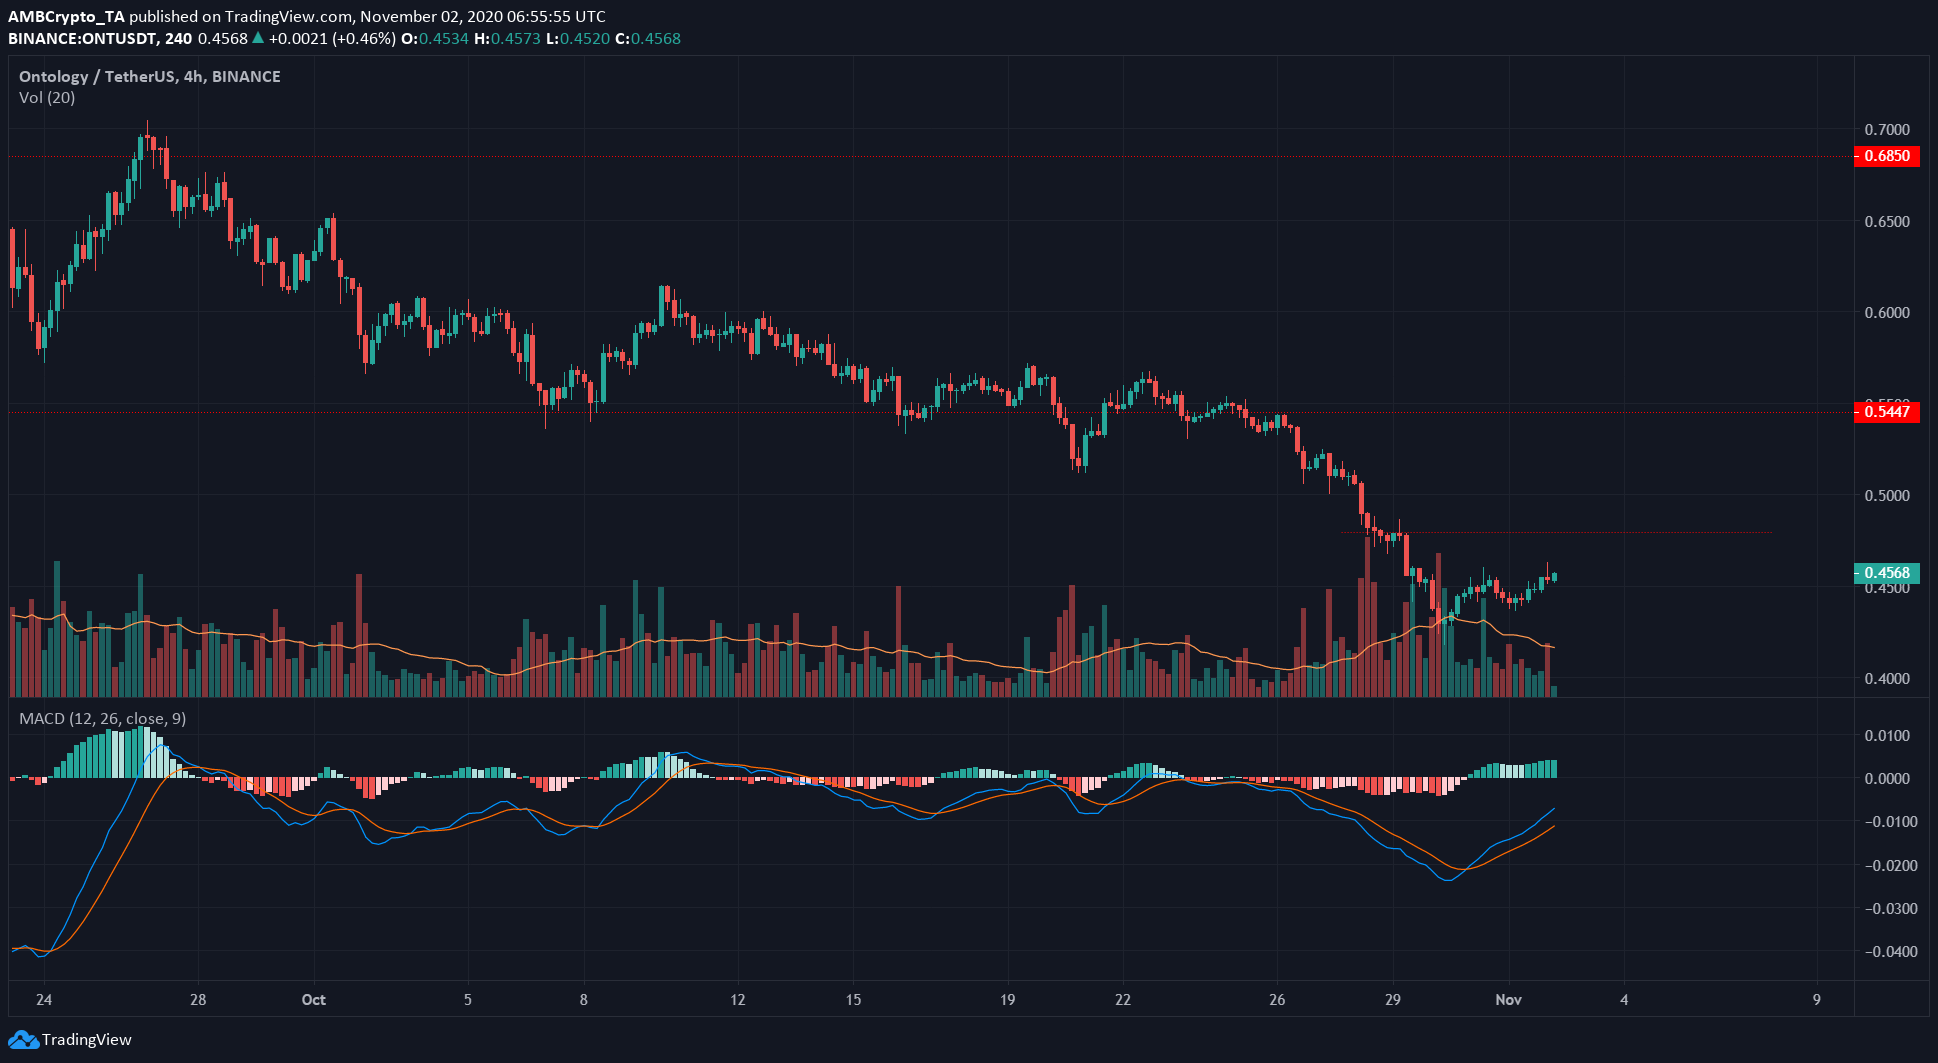
Source: DGB/USDT on TradingView
The moving averages captured the strong downtrend of the crypto-asset. The 50 SMA (yellow) was moving under the 100 SMA (pink), and DGB was trading just under the resistance at $0.02, but well below the 100-period moving average.
Even if the imminent level of resistance was flipped, the long-term outlook for DGB has been bearish. It would need to surge past the $0.022 resistance as well, to lend any credence to the notion of a trend reversal.