Tron, Ethereum Classic, Dash Price Analysis: 13 September

Bitcoin surged above its $10,400 resistance recently, in a move that could have a positive impact on the rest of the market. However, evidence of BTC being moved into exchanges might mean that there is another wave of selling pressure to be seen. Tron stagnated beneath a retracement level after a huge move upwards at the beginning of September. Further, Ethereum Classic appeared to have hit a local bottom and has been recovering since. On the contrary, Dash showed bullish momentum in the near-term.
Tron [TRX]

Source: TRX/USDT on TradingView
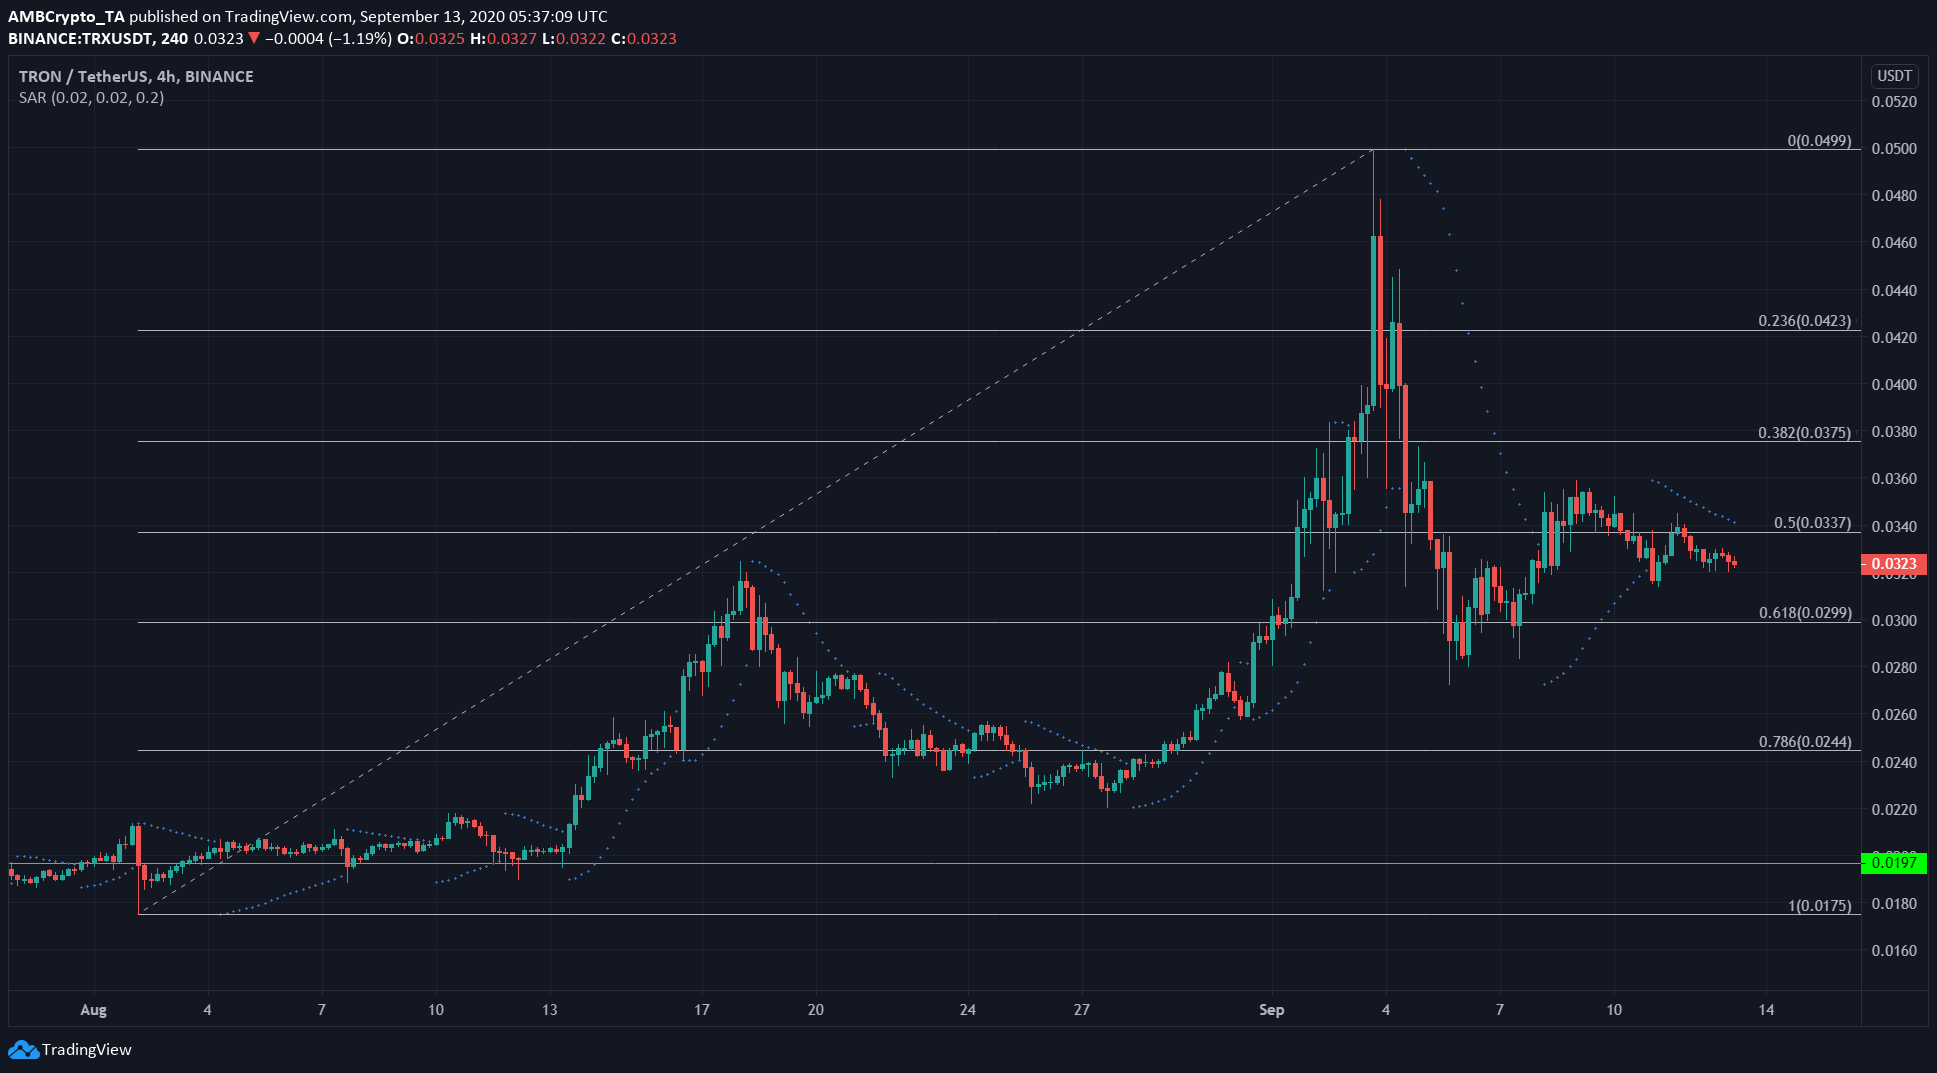
TRX was valued at $0.032, at the time of writing. It was trading just beneath $0.033, a zone that represents the 50% retracement level of its surge from August’s lows of $0.0175 to highs of $0.0499.
The Fibonacci Retracement tool highlights some levels of support and resistance for TRX in the near-term. The support lay at $0.0299, while resistance was found to be at $0.0375.
The Parabolic SAR was giving a sell signal, with the indicator’s dotted markers well above $0.033. This showed that TRX was bearish, at press time, and might exhibit bullishness only if it reclaimed the resistance level or recovered strongly from the support at the $0.029 level.
The news that TRON had entered into a strategic partnership with 1inch, a decentralized exchange (DEX) aggregator, did not seem to have had a positive impact on TRX’s price.
Ethereum Classic [ETC]

Source: ETC/USD on TradingView
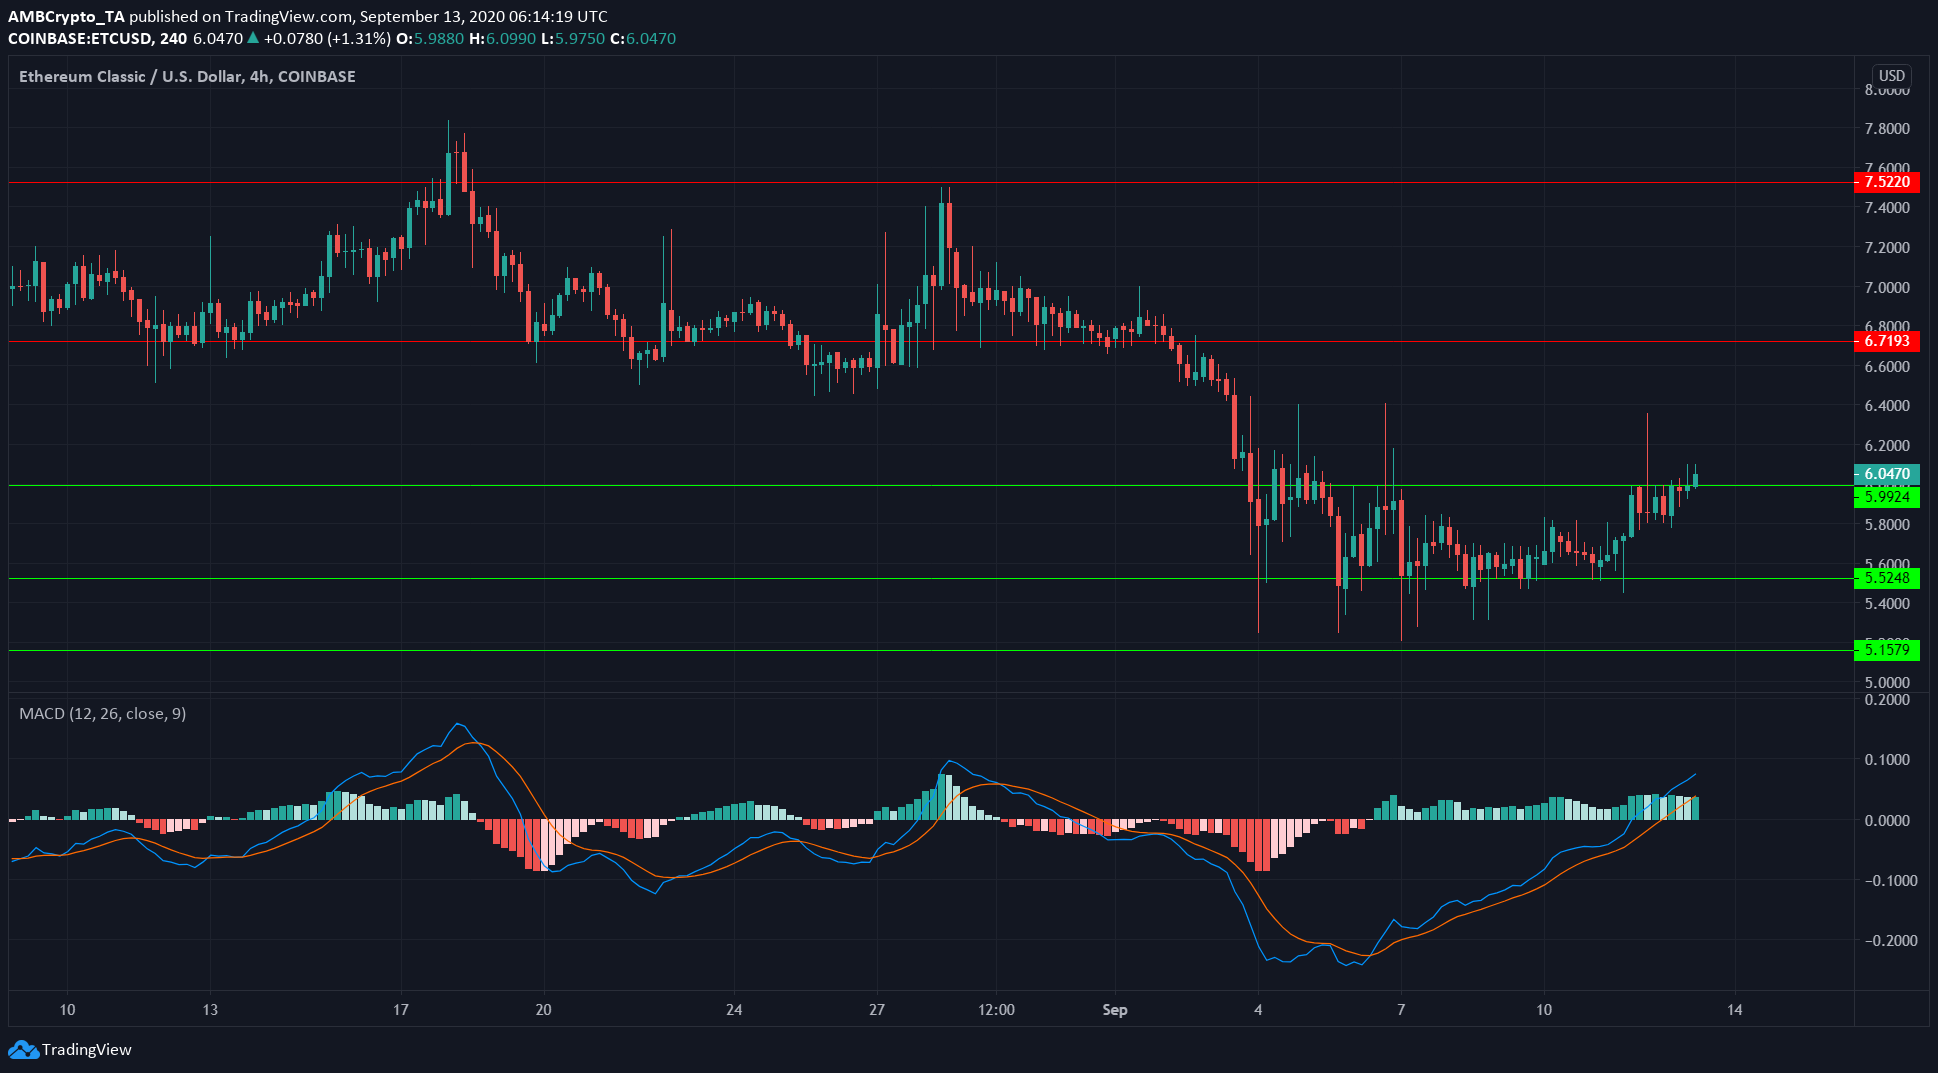
Ethereum Classic exhibited bullish signs as the MACD indicator suggested that the $5.52 level was the possible bottom for ETC during its recent drop.
The indicator formed a bullish crossover as ETC defended the support level of $5.52. The indicator in question continued to show bullishness, at the time of writing.
The next important level of resistance for the crypto-asset lay at $6.7.
A few days ago, Dexaran presented a solution to the Ethereum Classic community to prevent further 51% attacks after the blockchain suffered three such separate attacks in the month of August alone.
Dash [DASH]

Source: DASH/USD on TradingView
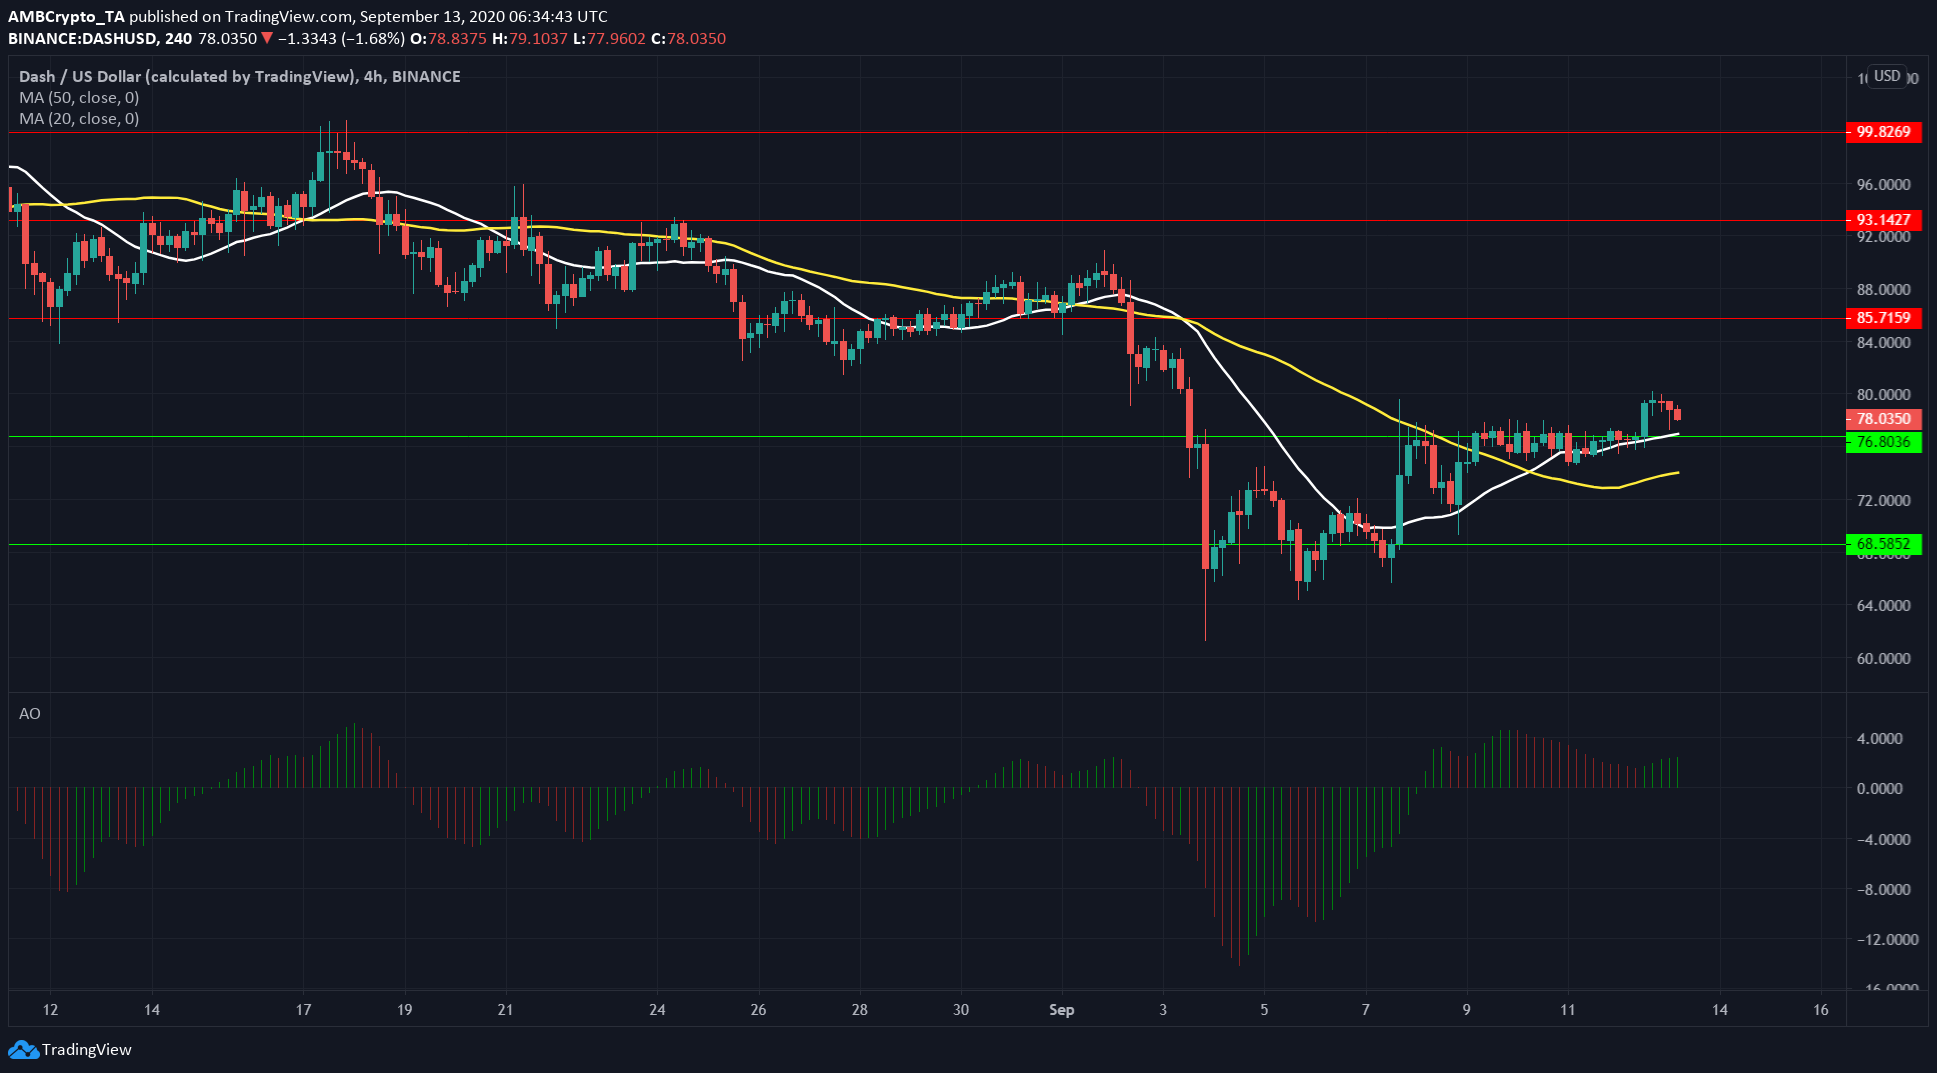
DASH had moved above its resistance level at $78, at the time of writing. It was also trading above its 20 SMA (white). The 20 SMA had also crossed above its 50 SMA (yellow) to highlight recent bullishness in the market.
The Awesome Oscillator also suggested that momentum remained in the hands of the bulls over the past few days.
The moving averages can be expected to act as support. DASH can use the positive momentum to climb to the next level of resistance at $85.


