The Crypto Fear and Greed Index noted a reading of 73 at press time as Bitcoin surged towards $13,000 and momentarily saw many large-cap altcoins follow suit. While Tron attempted to reverse its downtrend as it appeared to break past its trendline resistance, the bears were quick to enter the fray. Further, Algorand might face rejection at a level of resistance while Zcash showed that it might be able to break out to the upside in the coming days.
Tron [TRX]
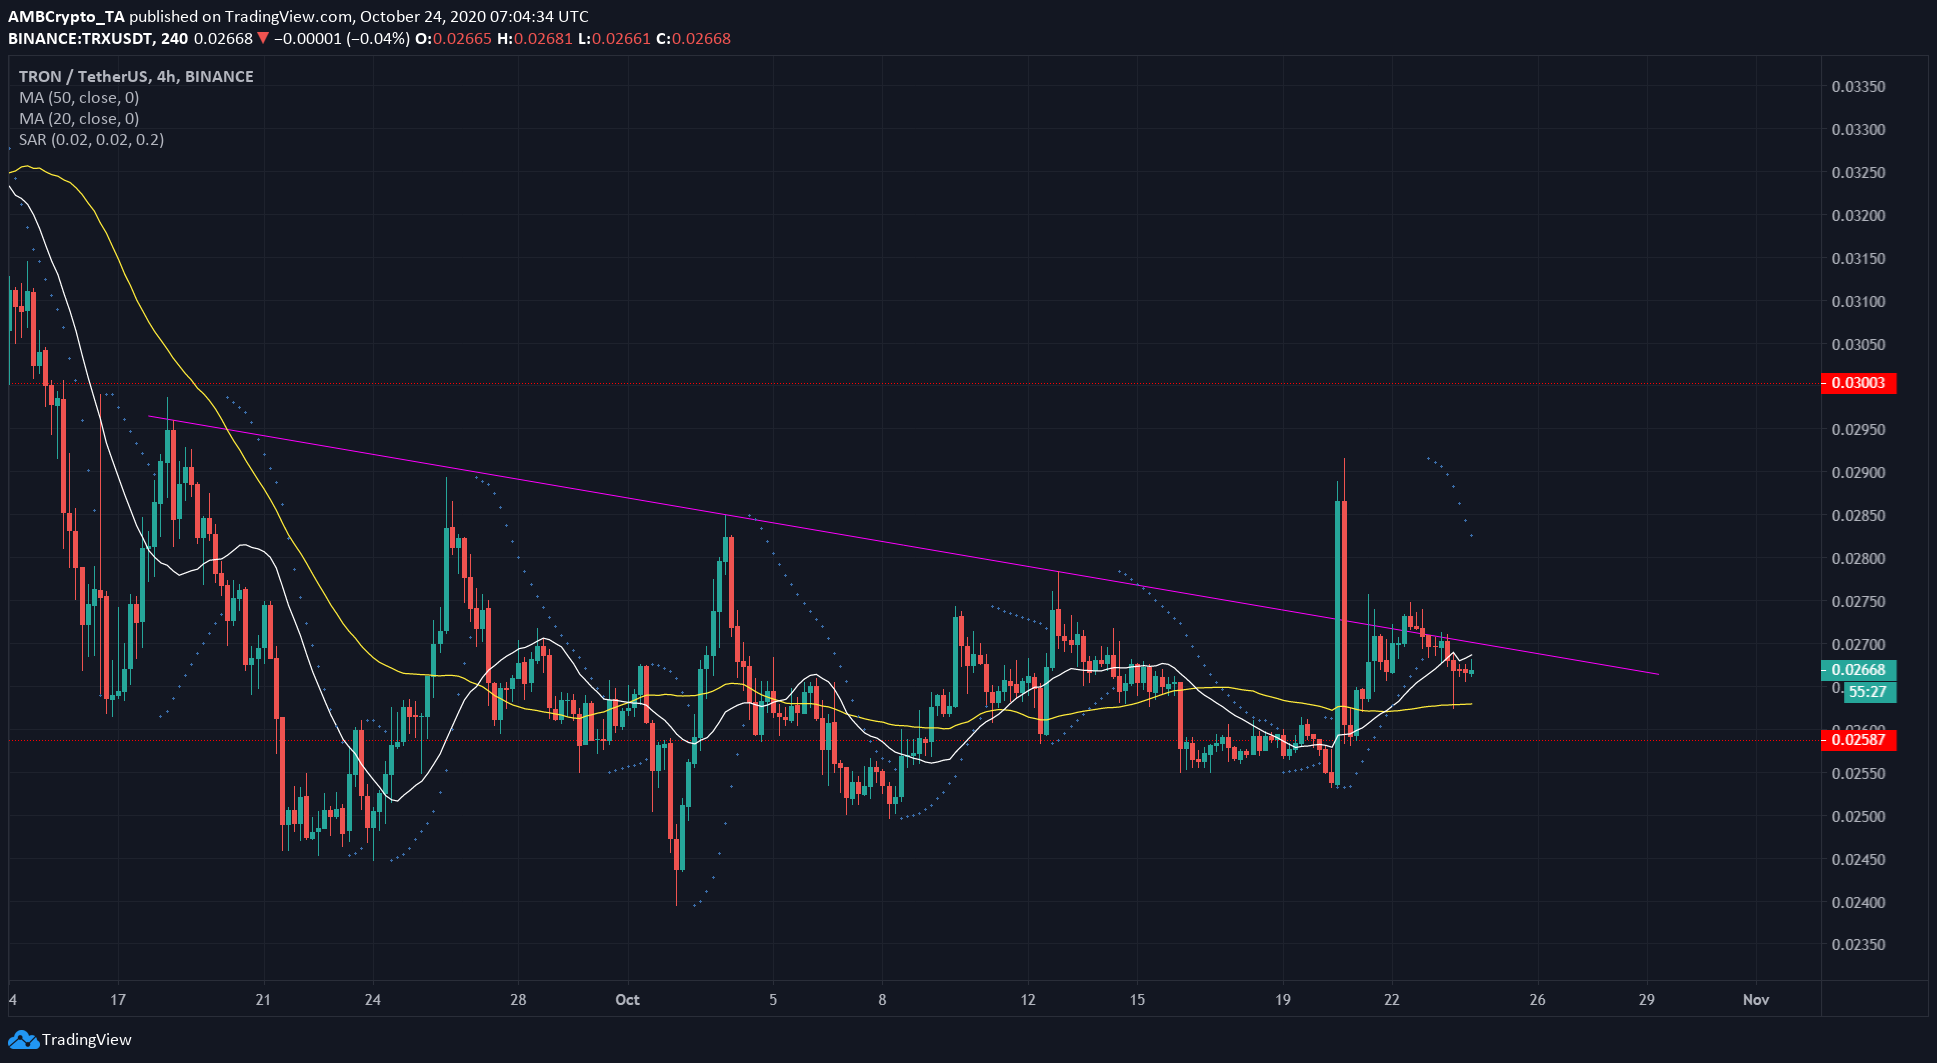
Source: TRX/USDT on TradingView
The cryptocurrency was trending lower (purple) on the charts, but with momentum that was lower than the same in the first week of September. News of Paypal’s plans to introduce its millions of users to Bitcoin fueled a collective surge in the market. While TRX did appear to break out, this surge was swiftly rejected.
Further, the moving averages showed that prior to the pump, the momentum was bearish, as the 20 SMA (white) was moving under the 50 SMA (yellow).
At press time, TRX had sunk below the trendline, with the Parabolic SAR also giving a sell signal.
Algorand [ALGO]
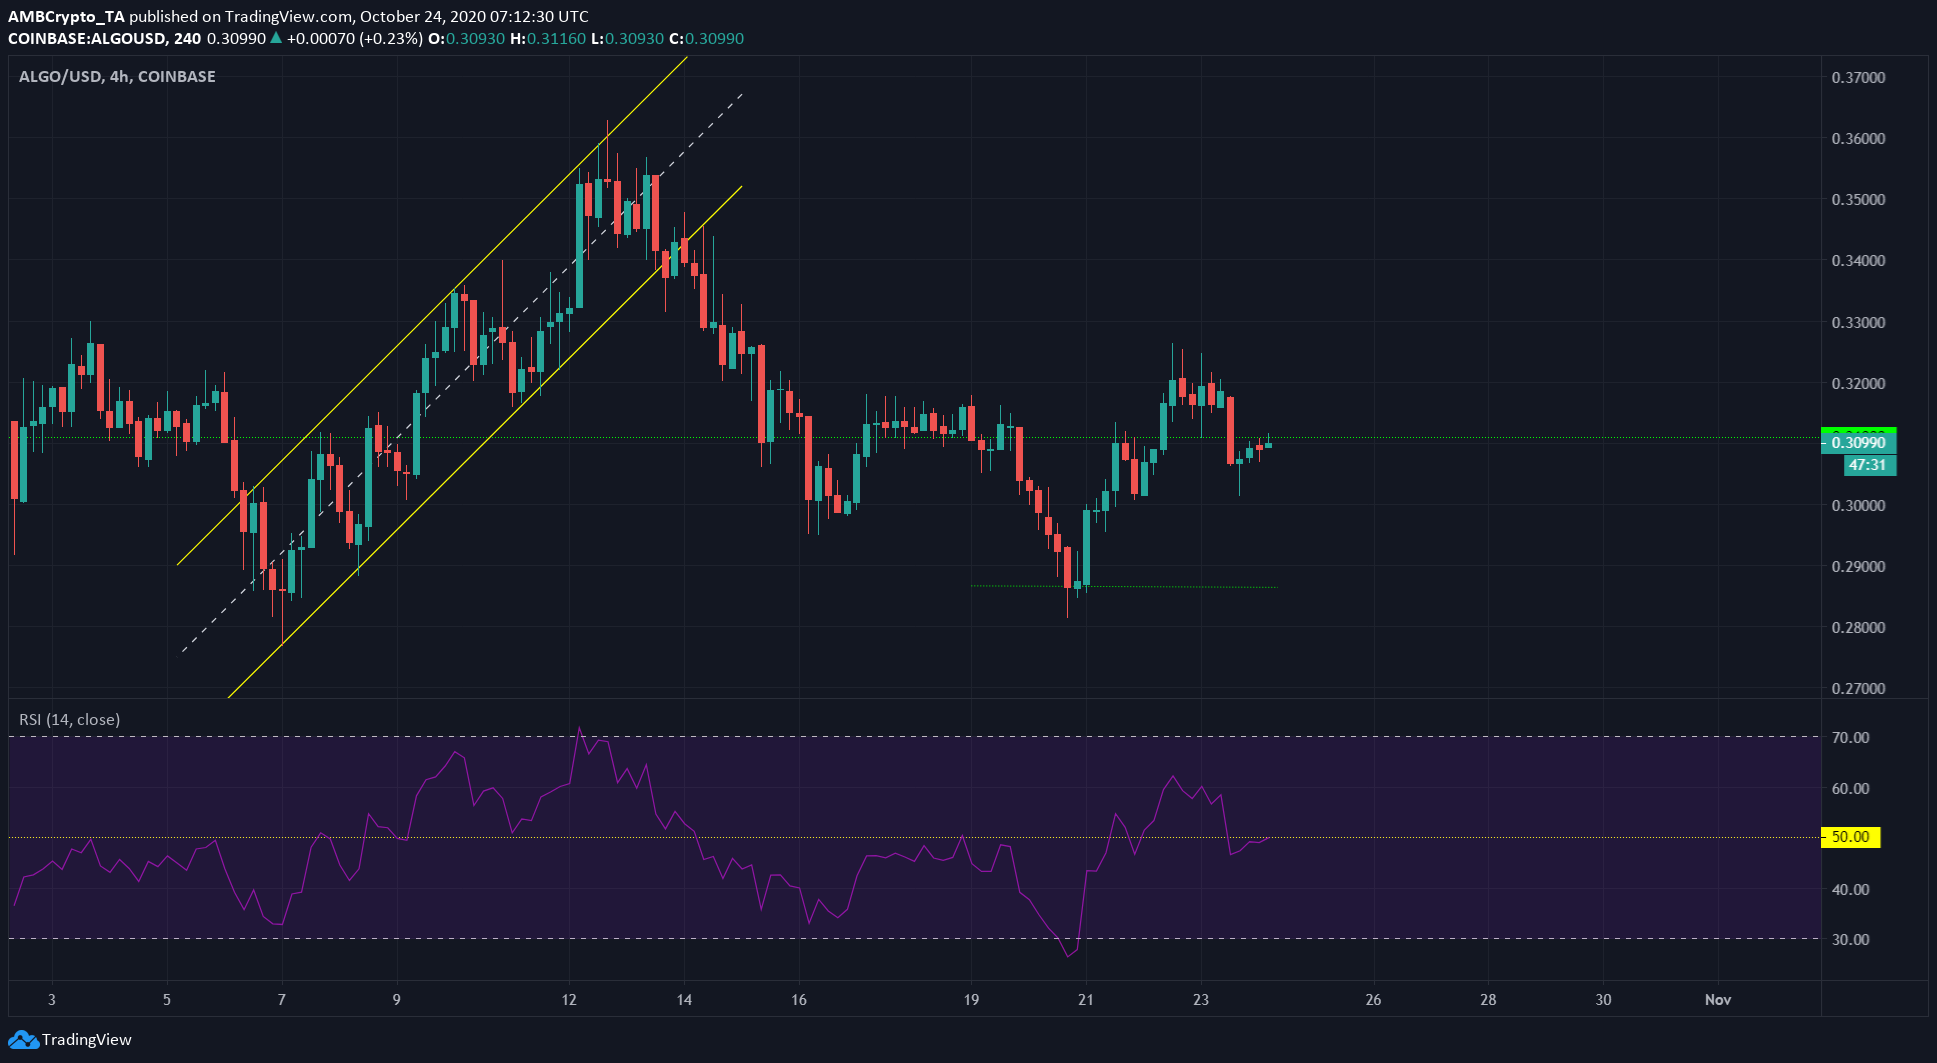
Source: ALGO/USD on TradingView
Algorand was moving within an ascending channel (yellow), and a close beneath the channel took the coin to the base of the channel near $0.28.
From there, the price bounced past its $0.3 resistance, but was forced under shortly thereafter and appeared to retest the same as resistance, at the time of writing.
The RSI showed that ALGO’s momentum was neutral. It has trended upwards for the past few days, but has also labored under a strong downtrend since mid-August.
Hence, it was likely that ALGO might see sideways movement or post some losses over the coming days.
Zcash [ZEC]
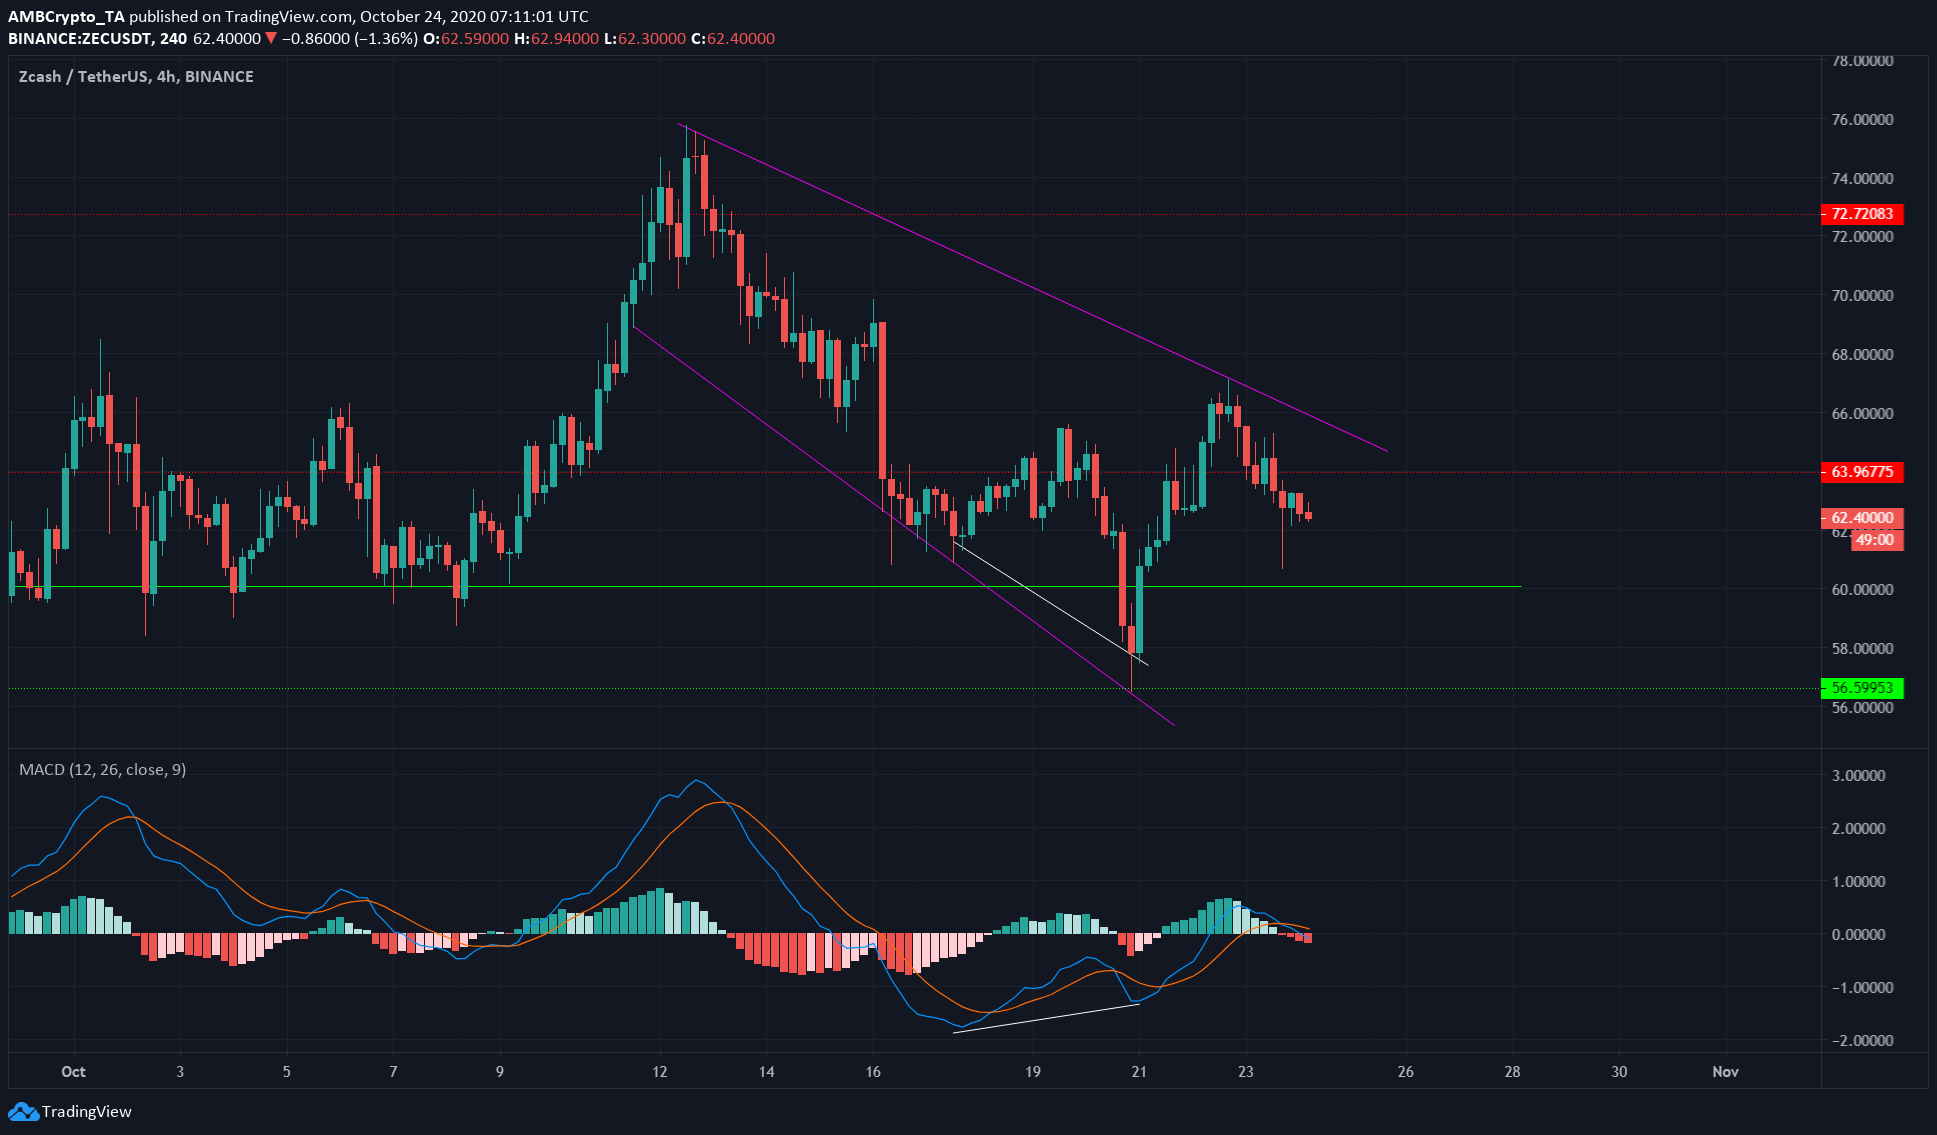
Source: ZEC/USDT on TradingView
The bullish divergence between the price and the momentum indicator was highlighted in white on the charts.
This saw the price surge from $57 to near $66, a classic shooting star candlestick, and subsequent steady losses.
Further, a broadening descending wedge (pink) was being formed over the past couple of weeks. This pattern generally sees a reversal of a downtrend and a breakout to the north.
Confirmation would be a close above the upper trendline in a trading session with above-average volume.