Tezos, Polkadot, QTUM Price Analysis: 10 October

Tezos, QTUM, and Polkadot, all registered a brief price correction on the charts over the course of the day’s trading session. Despite such corrections, however, the overall gains were up by almost 2% since yesterday for each of these digital assets.
While Tezos and Polkadot were noting some bullish weakness, QTUM signaled a dip in its volatility, a sign of price consolidation over the next few days.
Tezos [XTZ]

Source: XTZ/USD on TradingView
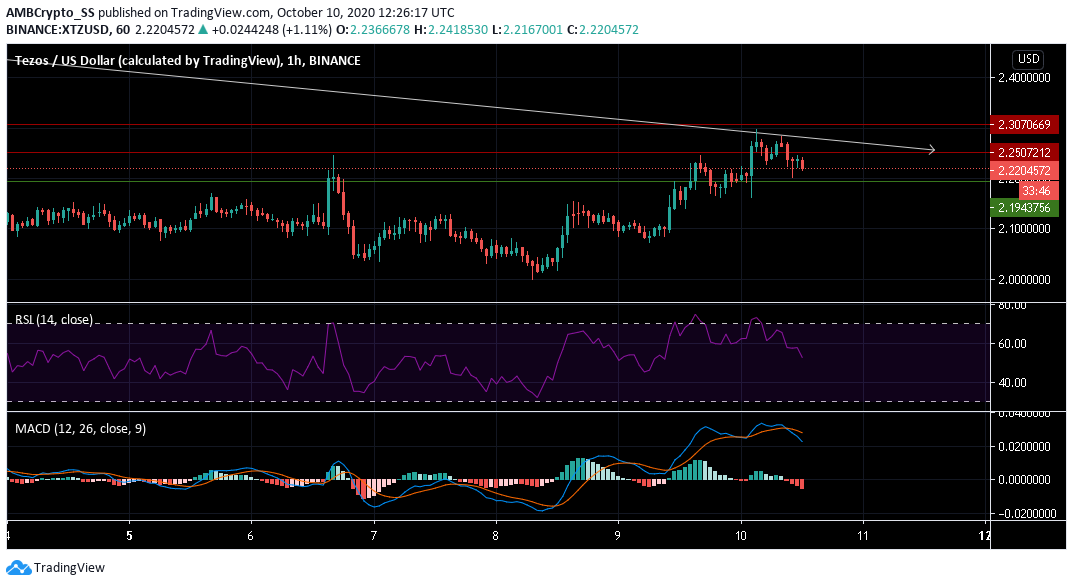
Tezos is likely to face some downward pressure as the market’s bears were continuing to maintain selling momentum towards the $2.19-support level. XTZ, however, had gained by nearly 2.5% in the last 24 hours.
The Relative Strength Index was seen diving towards the neutral zone of 50. If the trend were to continue, the bears could record the momentum to push the price below the immediate support level.
With high levels of bearishness visible on the MACD, the 10% price jump from the $2-level achieved over the last 48 hours might encounter a price correction soon.
In other news, in a bid to boost its DeFi development efforts, Tezos Stable Technologies recently closed a successful seed round from VC firm Draper Gorn Holm.
Polkadot [DOT]

Source: DOT/USD on TradingView
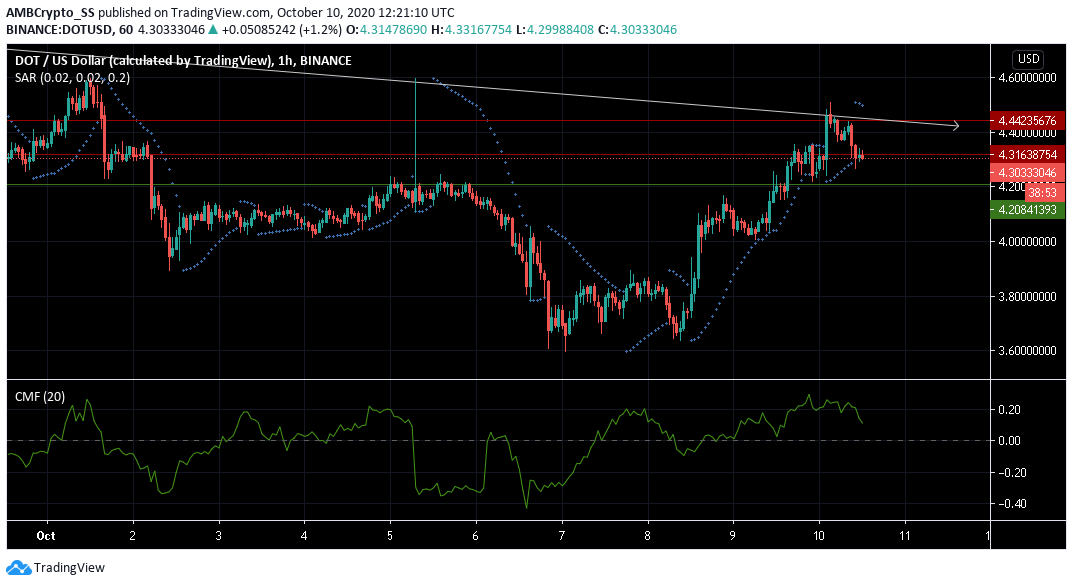
Polkadot was seen trading along its resistance level of $4.316. This followed a 2.5% drop in price since the morning trading session, recorded on its hourly chart. The digital asset, however, was still noting overall gains.
Polkadot has maintained an impressive uptrend over the last 3 days, and its recent bearish move may not be strong enough to break this momentum. The bulls too seemed to be in control around the $ 4.316-resistance level.
The Parabolic SAR was neutral, hinting at neither a strong uptrend nor a downtrend. Further, capital inflows were still higher than outflows, suggesting a weakness in selling pressure.
If the Chaikin Money Flow was to note a reversal to the upside, the bulls can once again be seen pushing the price above its immediate resistance level.
QTUM

Source: QTUM/USD on TradingView
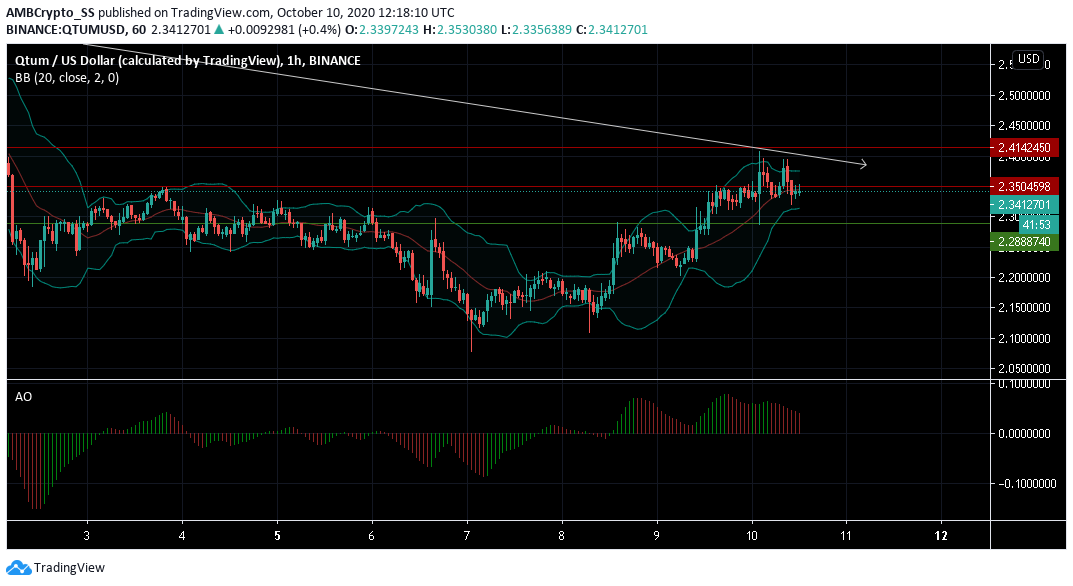
It is likely that the price for QTUM will encounter a brief consolidation period. This may happen, especially if the bulls fail to hold on to the $2.35-level of resistance.
The convergence of the Bollinger bands also outlined the possibility of lower volatility on the charts, restricting any wider price actions on either side.
At press time, a brief halt in the bullishness was also visible as the price dove slightly below the immediate resistance level. The signals picked up from an emerging bearishness on the Awesome oscillator had also given early signs of the same.
Conversely, if the sellers fail to gather momentum, QTUM’s price is also likely to resume its uptrend over the next few trading sessions.


