Analysis
Tezos, Neo, Zcash Price Analysis: 11 October

Bitcoin was trading at $11,333, at the time of writing, While BTC’s short-term movement has been sideways somewhat, its long-term returns have outclassed returns from traditional assets such as the S&P 500 and even the U.S Dollar. Over a shorter timeframe, Bitcoin’s move above $11,200 had a bullish outlook to it, and it is likely that the altcoin market will follow suit.
This was evidenced by the fact that while Tezos was primed for a breakout over the next few days, Neo might drop some more. On the contrary, Zcash looked to register further gains on its charts.
Tezos [XTZ]

Source: XTZ/USD on TradingView
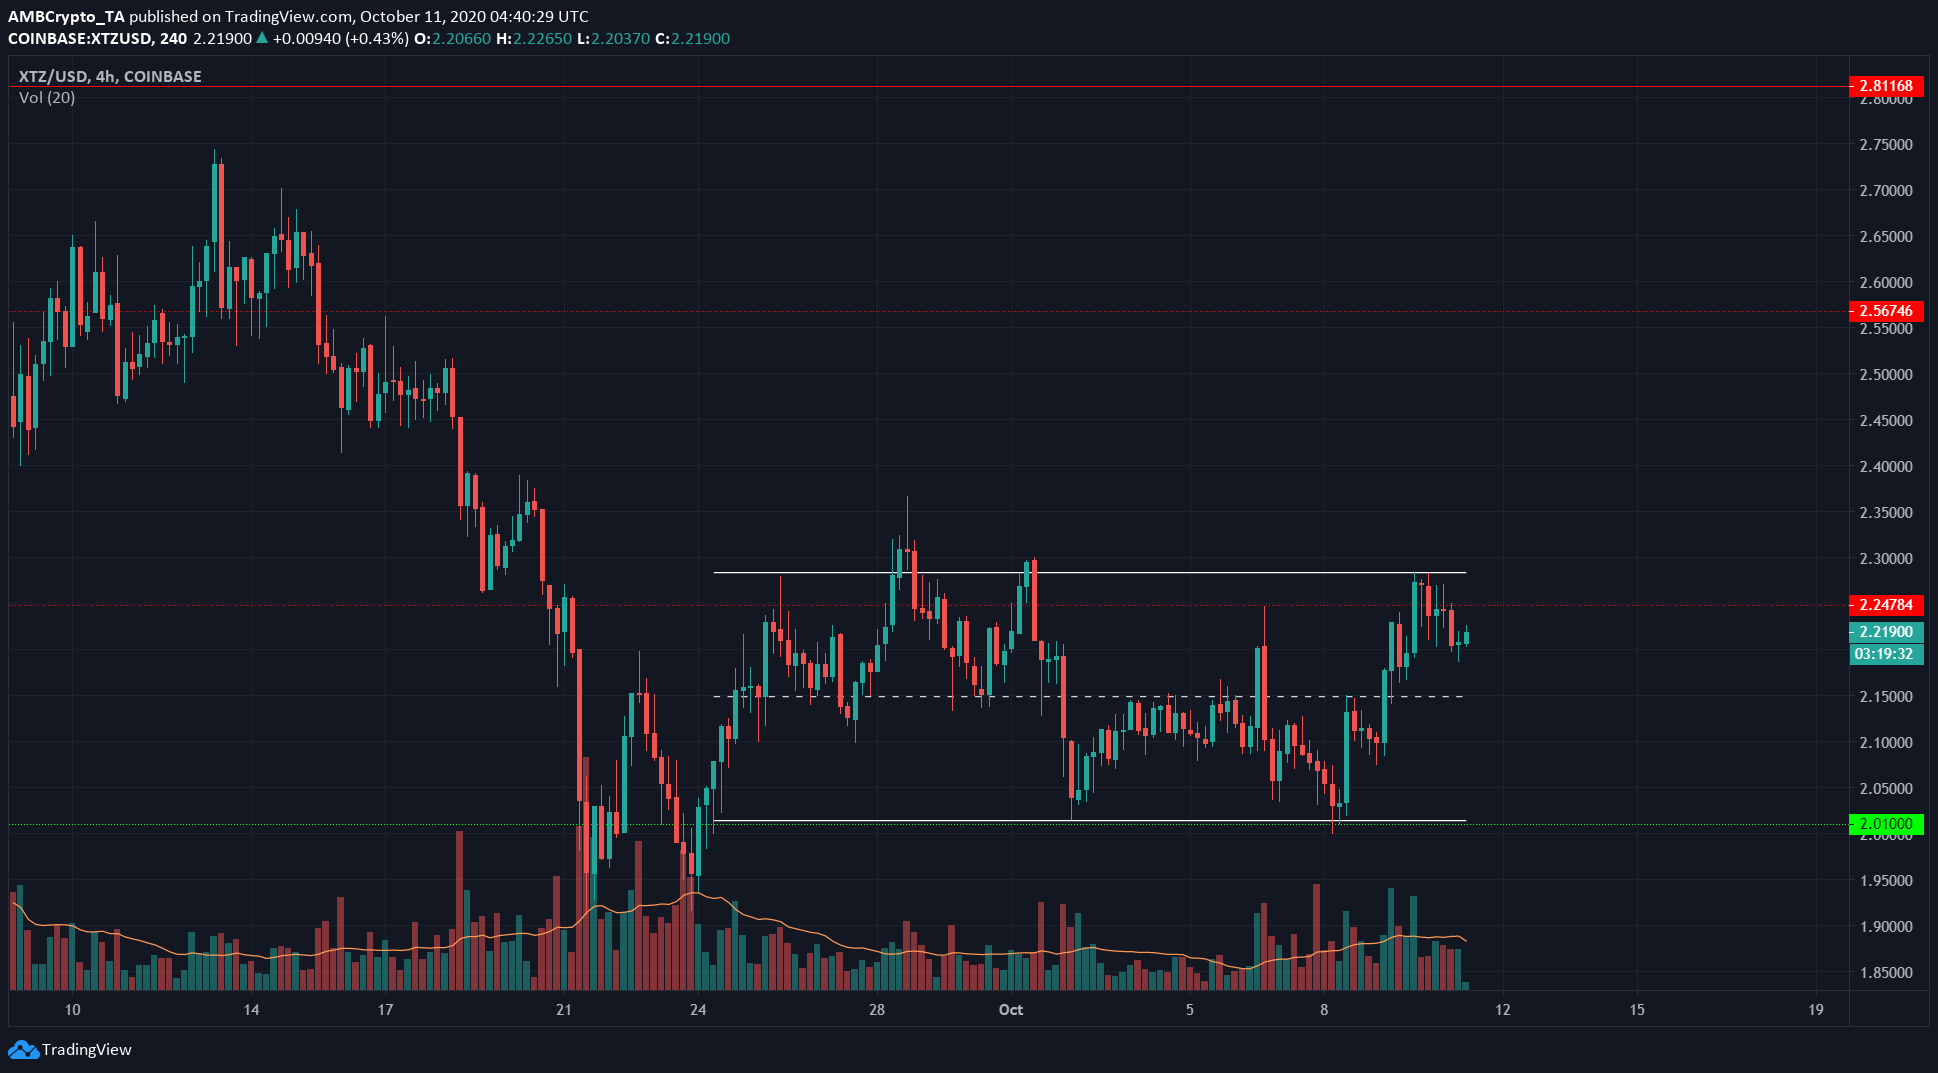
Tezos formed a rectangle bottom pattern. This is a pattern where the price bounces between two horizontal trendlines and since XTZ entered it from above, it is called a bottom.
Tezos, which has been in a downtrend since mid-August, might see further losses. A close outside the pattern would likely indicate a breakout in that direction, although successive closes can be used to determine the breakout more accurately.
Further, the volume within the pattern had no general trend. A breakout to either direction seemed possible for XTZ.
In other news, in partnership with Tezos and Microsoft, Lumos Labs has announced the launch of “The Century Program” to unearth 100 Indian start-ups with enterprise-ready blockchain solutions.
Neo [NEO]
Source: NEO/USDT on TradingView
Neo had closed outside a descending channel, but it lacked the momentum to rise towards its resistance at $19.5. The rise stalled at $18 and was slowly being pushed back down to the support level at $16.7.
As the OBV showed, the selling volume has been steady, and the latest hike’s buying volume was not enough interest in the crypto-asset to merit a breakout.
The Chaikin Money Flow also showed that the capital inflow into the market was at an end and buyers and sellers were reaching an equilibrium. It was possible that NEO would resume its previous downtrend in the short-term, although the longer timeframe outlook has been bullish.
Zcash [ZEC]
Source: ZEC/USDT on TradingView
Zcash found some resistance in the $64-zone and was unable to hold on to the level, despite closing above it over the past week. On its most recent attempt, the price flipped the level and at press time, appeared to be headed towards the next level of resistance.
The RSI noted a value of 66 and has been trending upwards in recent days. ZEC might find some resistance around the $70-zone as well, a level which buyers would need to overcome.

