Analysis
Stellar Lumens, BAT, Compound Price Analysis: 03 October

The crypto-market’s losses did not end with September, with the month of October noting further losses. In the short-term, many crypto-assets on the charts were dominated by bears. Stellar Lumens was among them as its every bounce was met by selling pressure. BAT was unable to shrug off bearish pressure too as it fell through a level of support following its recent drop. Further, Compound continued to struggle under a month-long bear trend.
Stellar Lumens [XLM]

Source: XLM/USD on TradingView
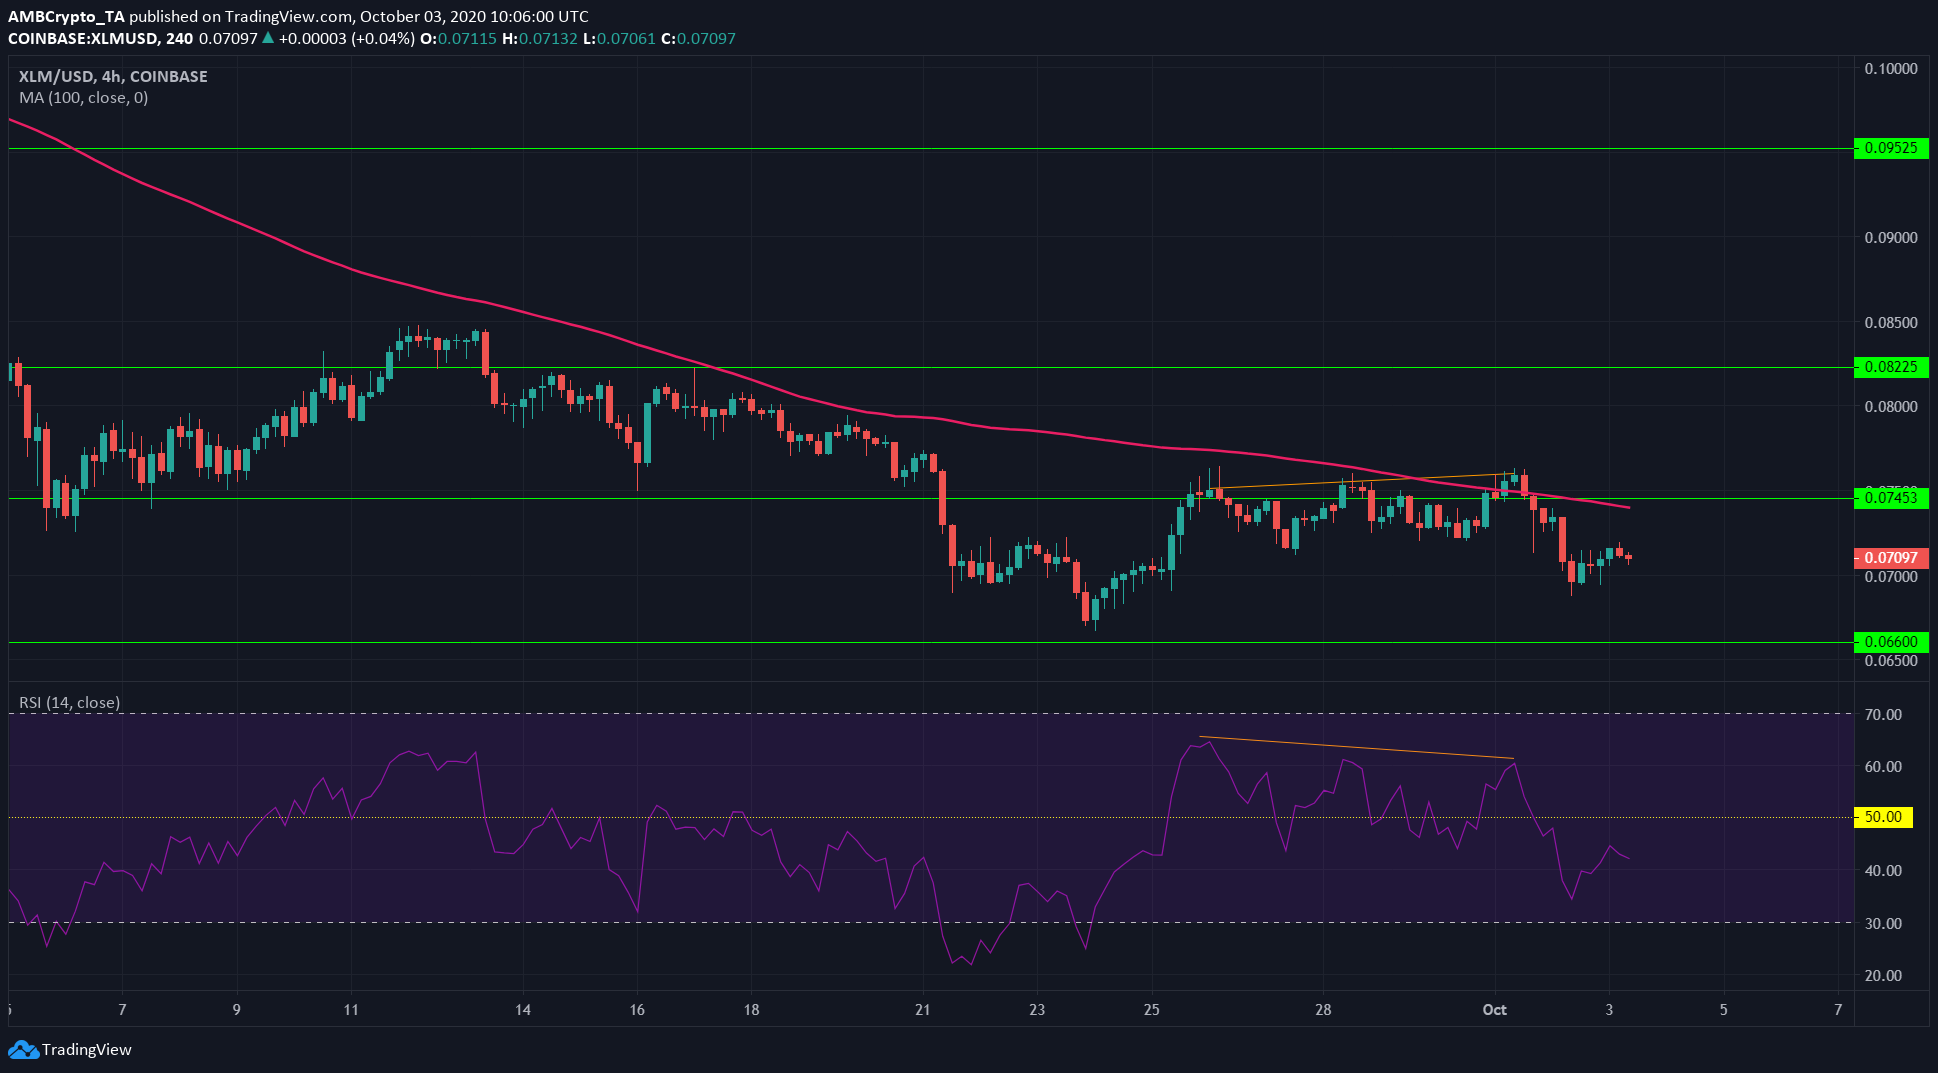
A bearish divergence was exhibited by XLM, immediately prior to its slump. The cryptocurrency’s price made a higher high while the momentum indicator (RSI) made a lower high, highlighted in orange.
At press time, the RSI showed a value of 42 and, along with the price, was likely to drop further. XLM can be expected to find support at the $0.066-level.
The 100 SMA (pink) was moving above the price, showing that the bearish trend for the crypto-asset was well established. This moving average can also be expected to act as resistance, alongside the $0.074-level.
Basic Attention Token [BAT]
Source: BAT/USD on TradingView
Basic Attention Token was moving within an ascending channel as it sought to flip the level of resistance at $0.24 to support. BAT sailed past its resistance, but crashed even quicker to climb to $0.211.
It also noted a minor pullback to $0.224, but the bears were in the driving seat as they drove BAT towards support at $0.2.
The OBV noted rising buying volume with the higher lows (white) on the brief uptrend before the selling volume (purple) undid most of the gains.
The OBV would have to post a higher low and higher high before it can be said that buyers’ interest was back in force in the market. In the near-term, the path of least resistance was to the downside.
Compound [COMP]
Source: COMP/USDT on TradingView
The drop from its highs of $262 in early-September was the beginning of the downtrend COMP has traded within since. The past month saw the Directional Movement Index indicate a strong trend in progress.
But, every such indication showed only a bearish trend in progress, and it was in evidence once more at press time. The ADX (yellow) surged above 20, highlighting the strength of the trend. The -DMI (pink) stayed above the +DMI (blue), denoting bearishness.
COMP has lost multiple levels of support and it could be set to continue seeing selling pressure.

