Analysis

Status, Algorand, Ethereum Classic Price: Convergence likely, but in opposite directions
Posted:

As Q1 of 2020 makes way for Q2, the converging altcoins, despite being willing to diverge away from Bitcoin, are deviating away from each other. Price movements, for the overarching altcoins market, continue to indicate that the price of these altcoins is moving closer and closer, but in varying directions.
Ethereum Classic
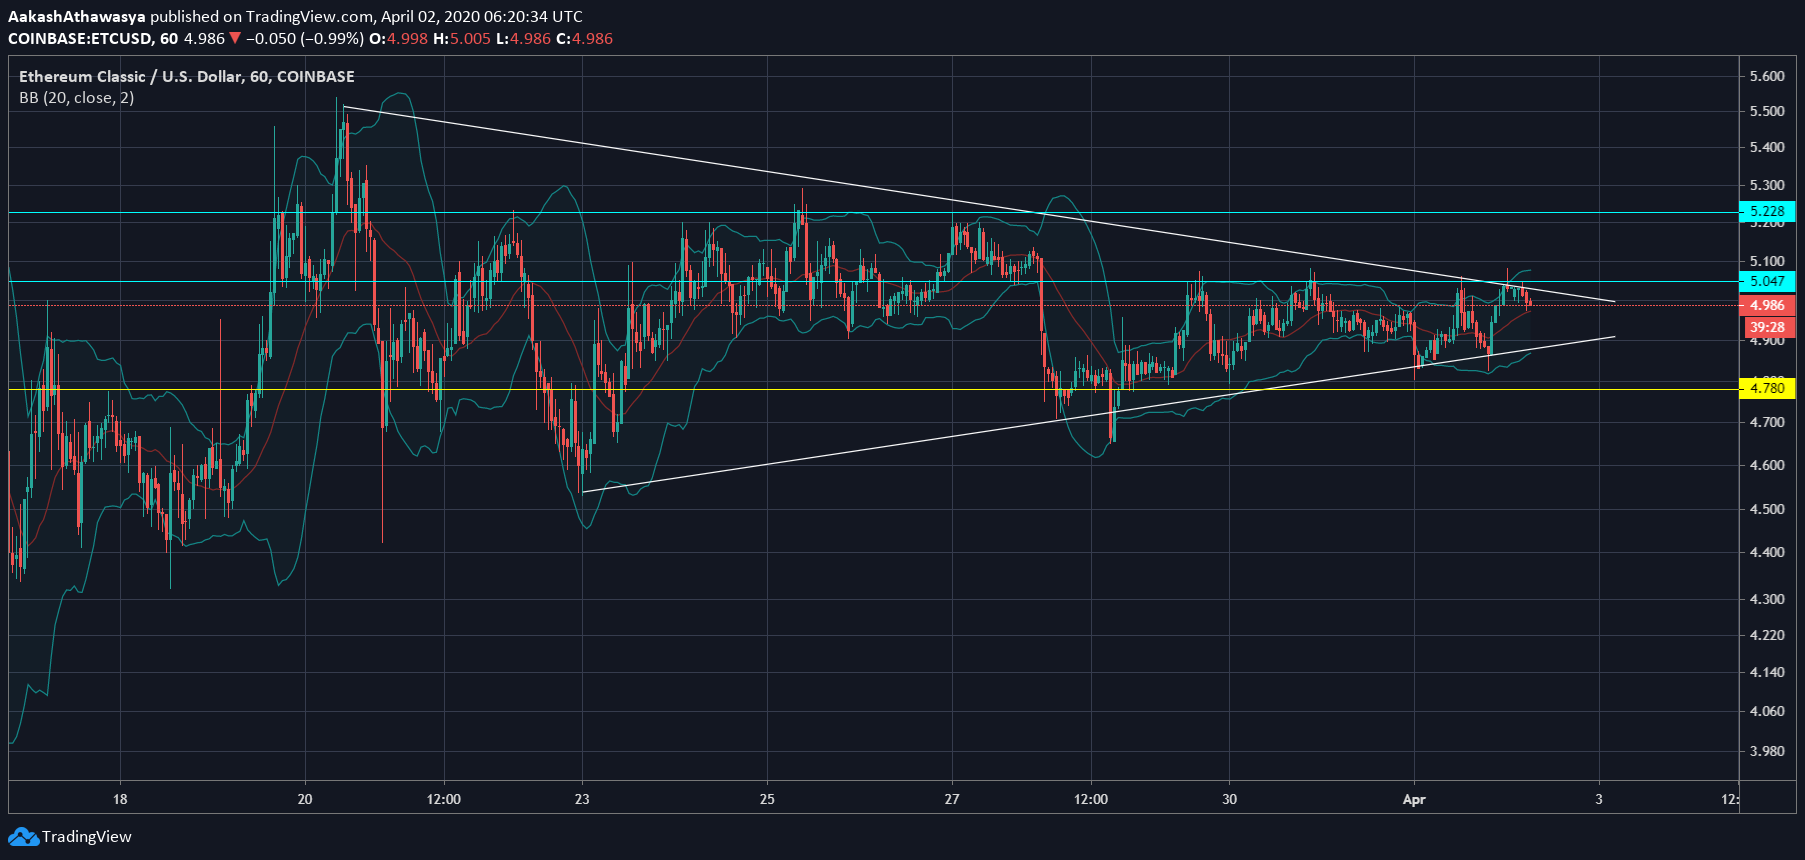
Source: ETC/USD via Trading View
The hardfork of the largest altcoin in the market, Ethereum Classic has been trading slowly, but surely, in a falling wedge, as lower highs and higher lows look to compound and eventually meet. The chart pattern began forming on 20 March as the price slipped from $5.5 to under $5, with the price, at press time, back over it.
With the wedge, a key support level at $4.78 was breached on 23 March and on 28 March, the recovery saw the price rise over it. As ETC was trading at $4.99, a key resistance level lay at $5.047, coinciding with the falling wedge’s upper limit.
The Bollinger Bands for the altcoin were slowly widening as the price moved up. At the same time, the average line had slipped below the coin’s press time price.
Algorand
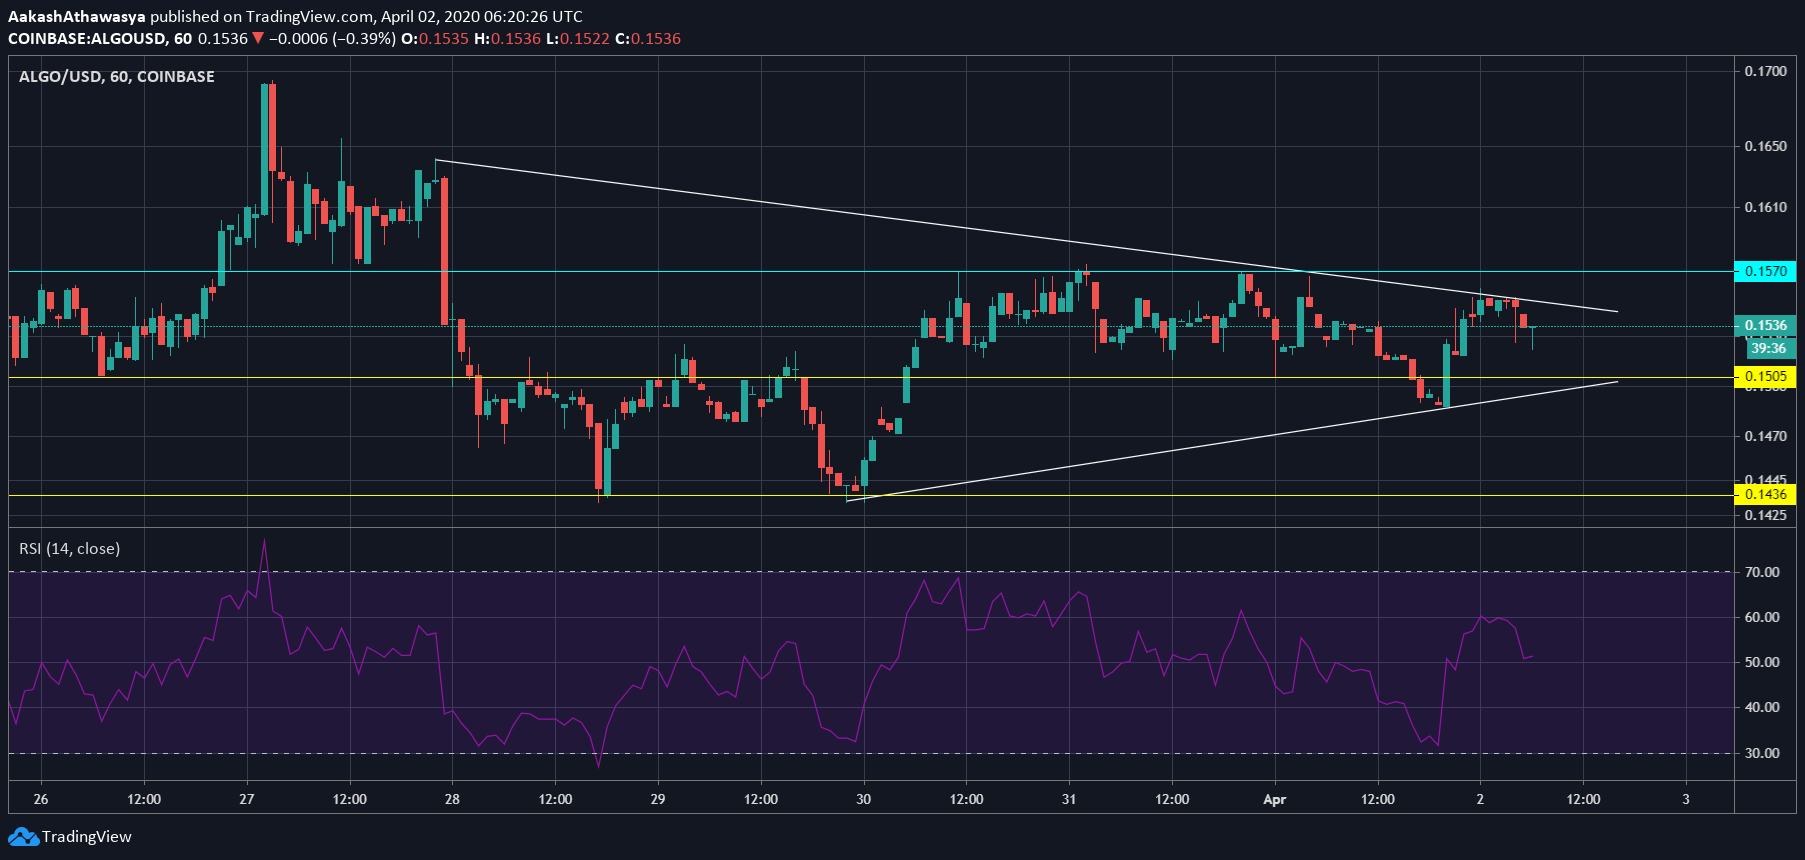
Source: ALGO/USD via Trading View
Another altcoin stuck in a falling wedge, although at its premature stage, is Algorand. The altcoin saw a bearish spread from 28 March to March 30, followed by a price rise that breached two support levels at $0.143 and $0.150, with the coin trading at $0.153, at press time.
The falling wedge’s two halves were disproportionate in terms of price effects but presented a common pattern; higher lows, which from $0.14 had moved to $0.152. Looking up, a key resistance level lay at $0.157, which pushed back the coin’s price on three occasions.
The Relative Strength Index of the altcoin after surging on 1 April, had dipped sharply, at press time, and was just above 50, a relatively healthy buying pressure.
Status
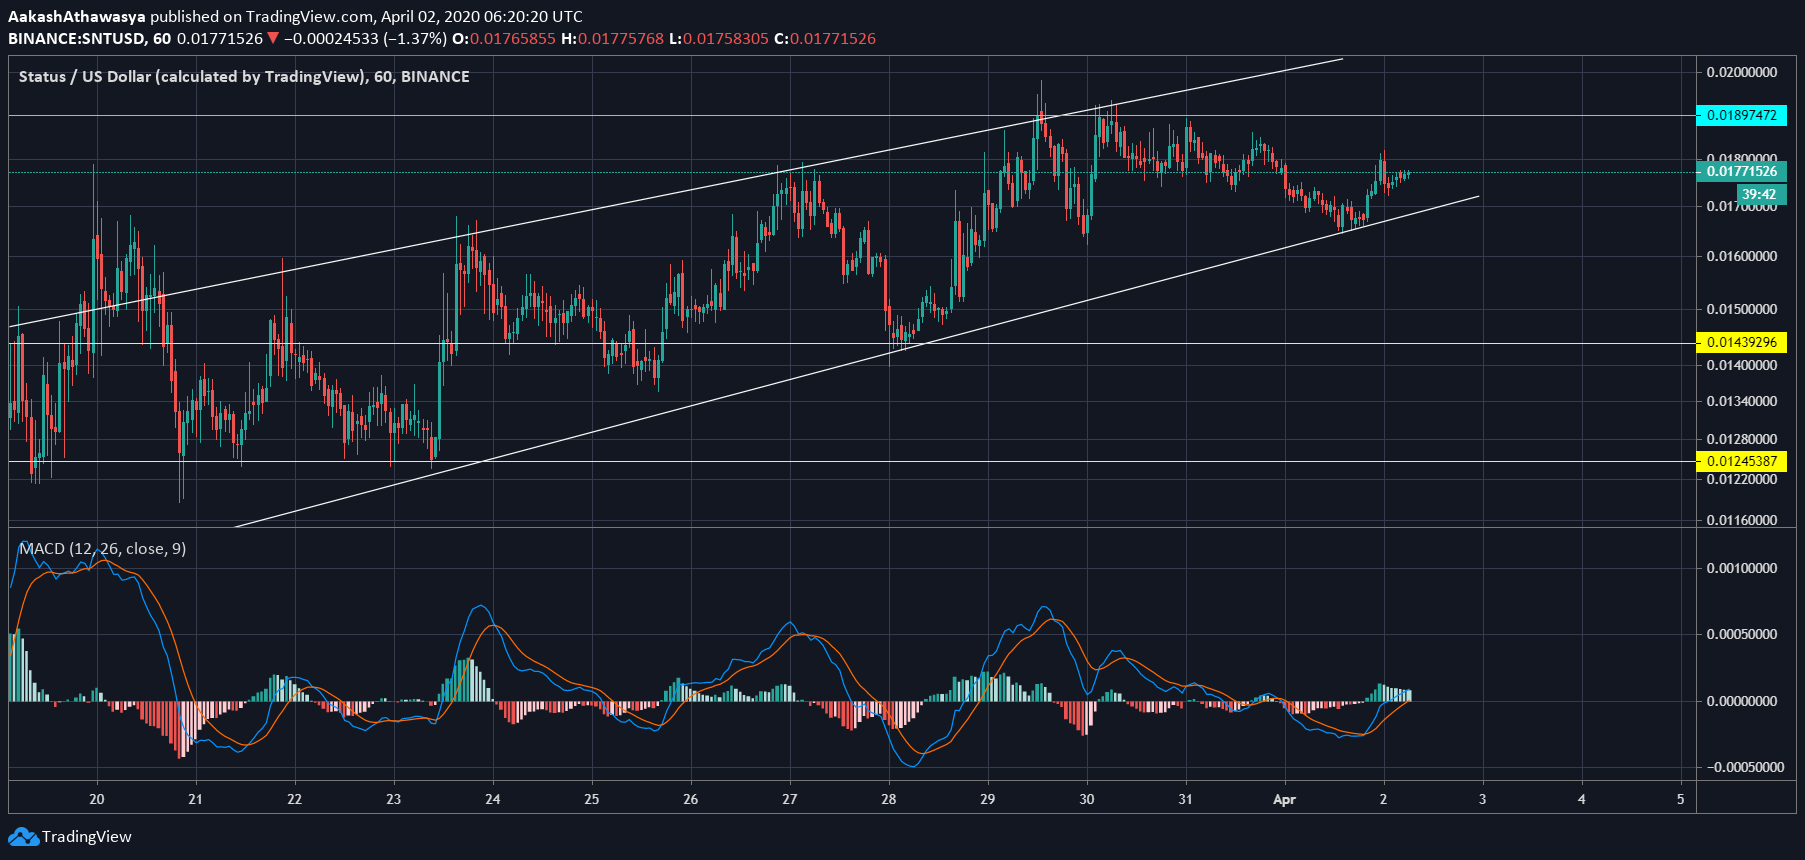
Source: SNT/USD via Trading View
Status, unlike the other two altcoins, was trading in a mild wedge, almost resembling a channel. And unlike the other two altcoins, its chart pattern was rising, not falling. The upward channel was rooted in the 19 March price rise from $0.009 to $0.015, and at press time, the price stood at $0.0177.
During this massive run, which began as the price broke the $0.0124 support, SNT was traded within the narrow channel and managed to break yet another support level at $0.0143. Looking up, the resistance level at $0.018 pushed the price down twice.
The MACD indicator for the altcoin was bullish as the MACD line had overtaken the Signal line and was trending above 0.