Several altcoins are closely treading along Bitcoin’s price movements, had witnessed a return of buying sentiment, pushing the price above key support levels during the last week of September. At press time Bitcoin was being traded at $10,860 after having noted a 1.1 percent hike in the past 24-hours.
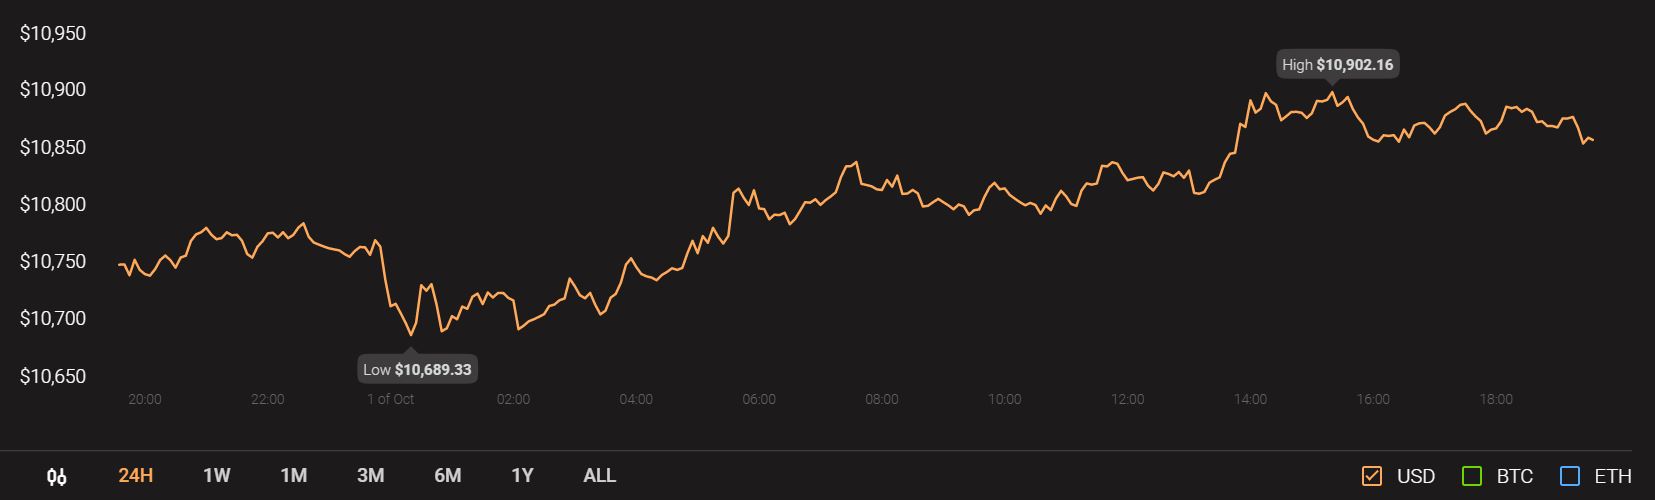
Source: CoinStats
After a massive price correction last month, Polkadot, Stellar Lumens and IOTA have been consistently seeing a good price recovery as they manage to return to pre-September levels.
Polkadot [DOT]
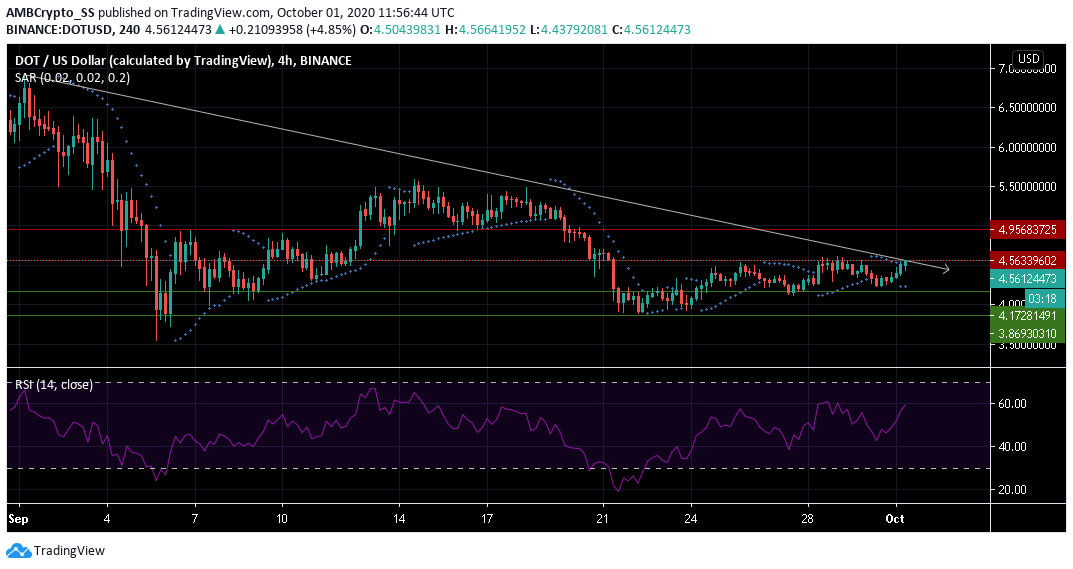
Source: DOT/USD on TradingView
At the time of writing, Polkadot was seen constricted between the support and resistance levels of $4.178 and $4.563 and failed to breach this resistance at least twice over the last 72 hours.
However, up by 5.76% since yesterday with a valuation of $4.561 at press time the digital asset, marked a notable high from its recent lows at the support of $4.178.
The dotted lines of the Parabolic SAR below the Polkadot price candles depicted a bullish trend for the coin. The Relative Strength Index at the 60-level indicated a rising sentiment of buying pressure in the market.
The current scenario, being bullish, may see the digital asset further rising above its current resistance level of $4.56, or may repeat the reversal trends as seen on 26 and 28 September.
However, unlike the previous two events, a bullish breakout above the trendline at $4.56 level, also acting as a resistance level, remains another likely scenario.
Stellar Lumens [XLM]
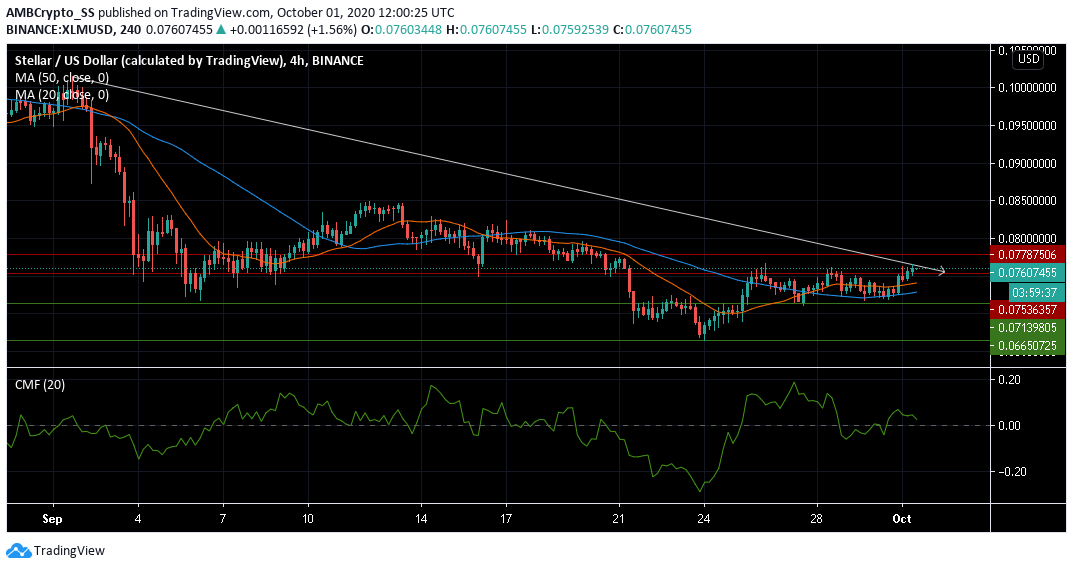
Source: XLM/USD on TradingView
Over the past few days, Stellar Lumens’ (XLM) bulls have managed to breach the resistance of $0.075 signaling the buyers remained in firm control of this region. At press time, XLM traded at $ 0.076. This price region was previously a strong support, during the second half of September.
The Chaikin Money Flow Indicator signaled a dip in the level of capital inflows, although still above the zero line, inflows remained higher than outflows, ruling out any immediate sell-off threats.
The moving averages were bullish with the 20 SMA above the 50 SMA. With the overall setup still bullish, traders could wait for a retest of the immediate resistance level at $ 0.075, before taking a long call.
IOTA
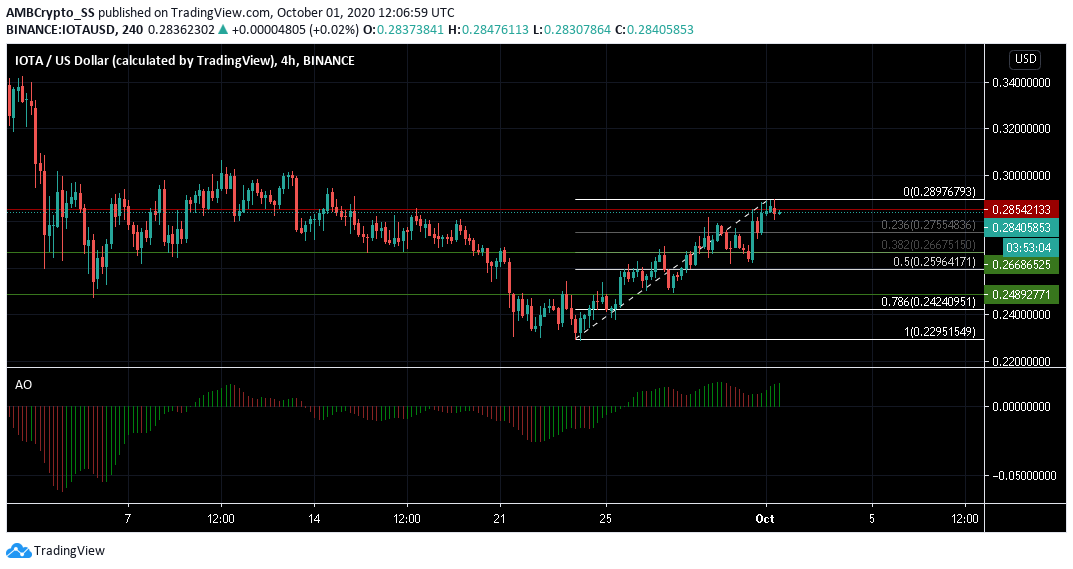
Source: IOTA/USD on TradingView
IOTA had witnessed impressive gains over the past week and was at the time of writing trading below its immediate resistance of $ 0.285
With near-term technical indicators painting a bullish picture, IOTA’s price was closing in near its September highs. The Awesome Oscillator was well into the bullish territory, closing in with multiple rising green bars, above the zero line.
A breach of the current resistance level at $0.285 and subsequently the $0.289 Fibonacci retracement region marked using the Fibonacci retracement tool, may solidify the bullish trend further, as the buying momentum grows.
The digital asset was recently in the news for launching their new service ‘IOTA Access’, a DAPP protocol to bring a secure, highly-configurable, and permission-less framework to smart devices around the globe.