![Polkadot [DOT] short term price analysis: October 28](https://eng.ambcrypto.com/wp-content/uploads/2020/10/PA-5-featured-2-e1601894381471-1024x683.jpg)
Although bitcoin hit $13,800, it seems like altcoins didn’t share the enthusiasm, as most coins including Polkadot, saw a decline. Perhaps, this rally was centralized to bitcoin and very few altcoins, and Dot wasn’t among them.
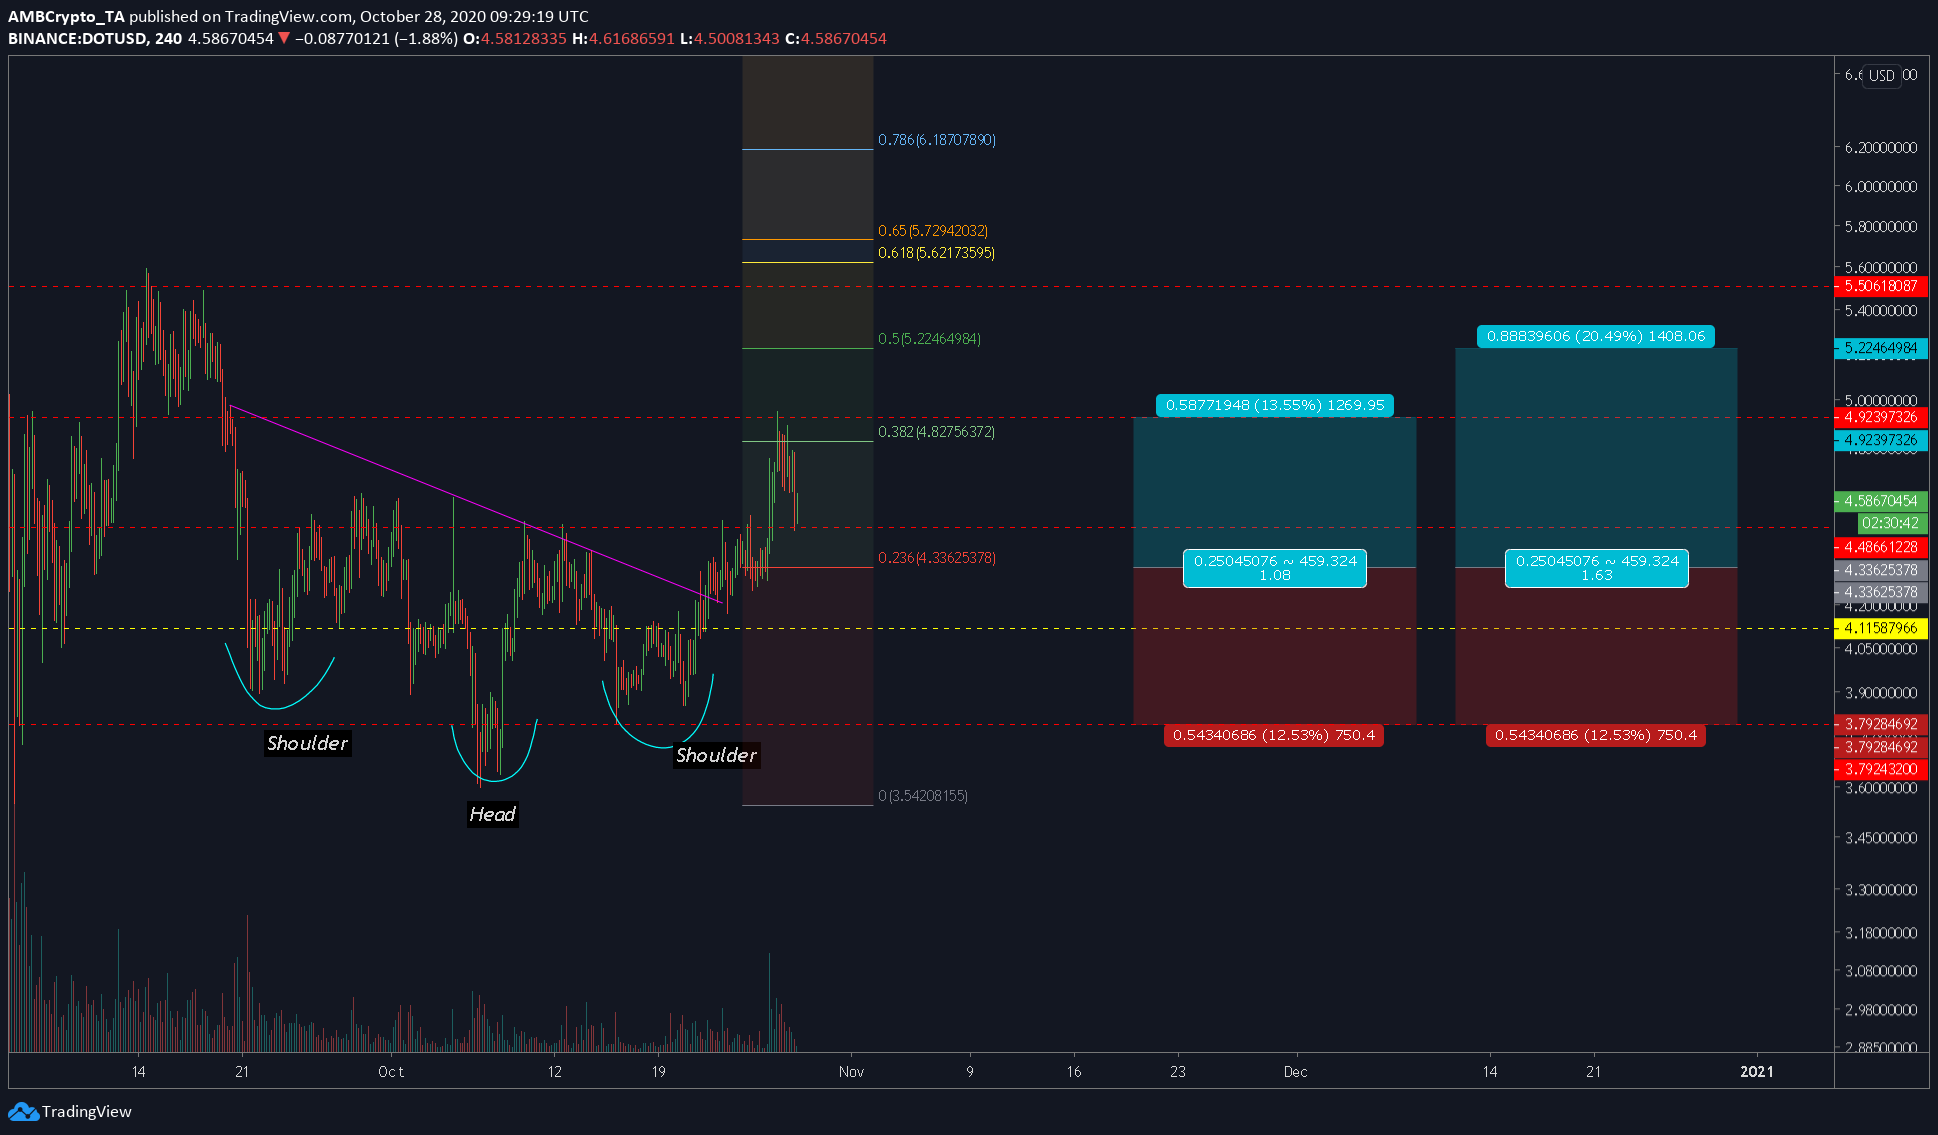
Source: DOTUSD TradingView
At press time, Dot is trading at $4.601 and is in the top 10 list of cryptos. From the last prediction [see the chart attached above], the target was spot on, however, the price has retraced from that level. This article will take a look at the short-term movements of price and what to expect.
Polkadot 1-hour chart
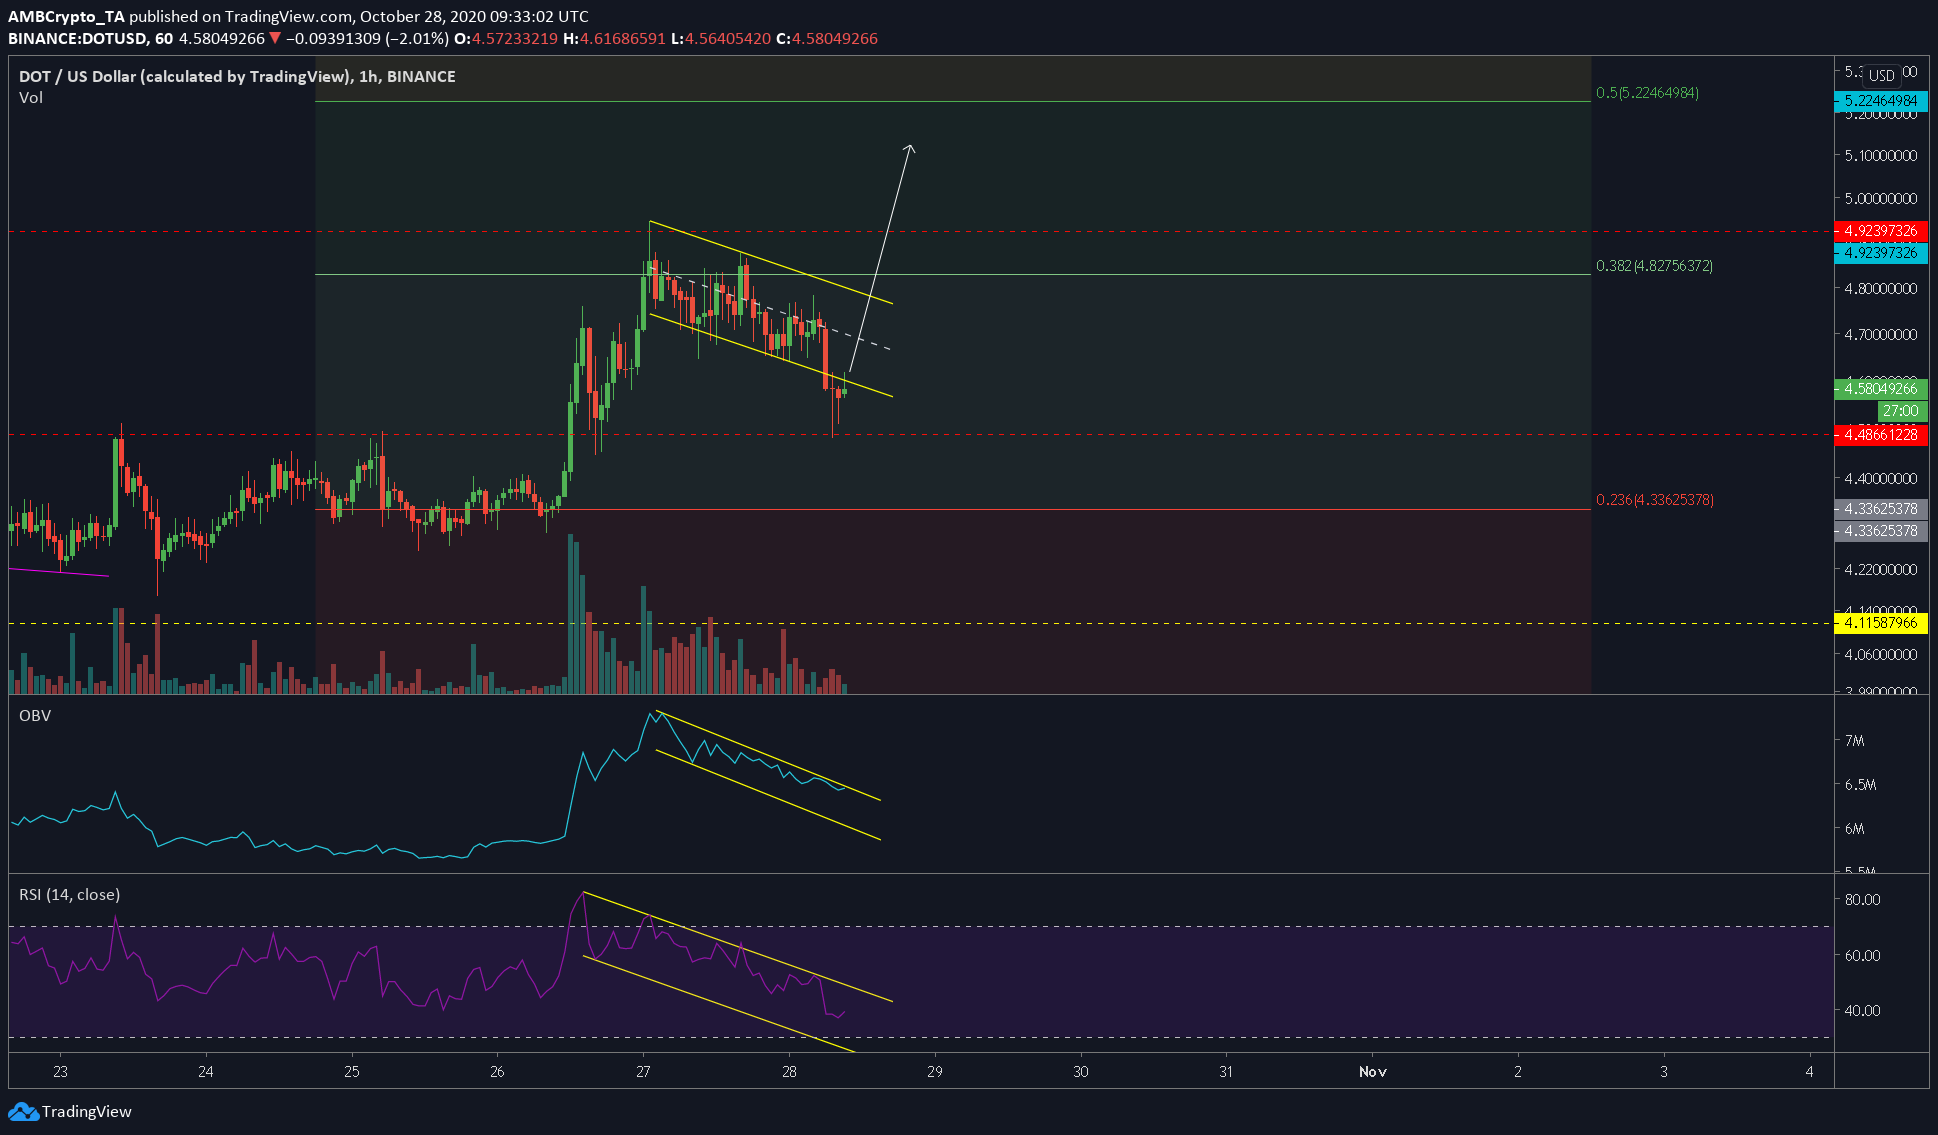
Source: DOTUSD TradingView
This chart can be broken down into patterns, levels, and indicators. The pattern formed is a bullish one – ascending channel and bull flag. Hence, we can expect the price to head higher soon.
As for the levels, the previous target was $4.92 and the same might be today’s target, but it will definitely resist the price from making higher moves. Other levels include the ones shown by the Fibonacci extensions.
The price has, however, broken down, which means it was a fakeout, before the actual breakout, and it happens in the crypto ecosystem quite often. This hurts the performance of the coin.
As for the pattern, the ascending channel combined with the previous trend forms a bullish flag. The theoretical target for Dot includes $5.117, just below the 0.5 Fibonacci level and this is being conservative with the target.
Rationale
The reason why Dot could go long is the pattern’s bias and indicators. The RSI indicator has seen a drop-down to the oversold level due to extreme selling pressure from the bears. More drop might push it deep into the oversold zone. However, for now, the price has tapped the support level at $4.48, and expecting a rebound from here isn’t bearish.
The OBV has also seen a drop with the price, which means that the bears are losing out their steam with this sell-off.
Conclusion
Although the price does look bearish due to the recent drop, expecting a bounce would be the best thing to do. However, since there was a fake-out, entering the trade would a risk move.