![Polkadot [DOT] long-term price analysis: November 19](https://eng.ambcrypto.com/wp-content/uploads/2020/10/katie-mcnabb-8AJuvX4hzws-unsplash-1024x769.jpg)
Polkadot has competitors that claim the same thing as DOT – throughput that achieves scalability, lower fees, security, and the ability to build a defi ecosystem on its chain. However, only a few actually deliver these things and are yet to gain adoption.
The adoption isn’t here yet due to the fact that Ethereum is still the defi creator and the defi darling. Hence, it is a go-to blockchain for almost everything, even with reduced efficiency. It is the first-move advantage that ETH has that Dot or its other competitors don’t. As soon as this fades, people will migrate to the next chain, which is frankly, impossible to know/determine.
Dot 4-hour chart
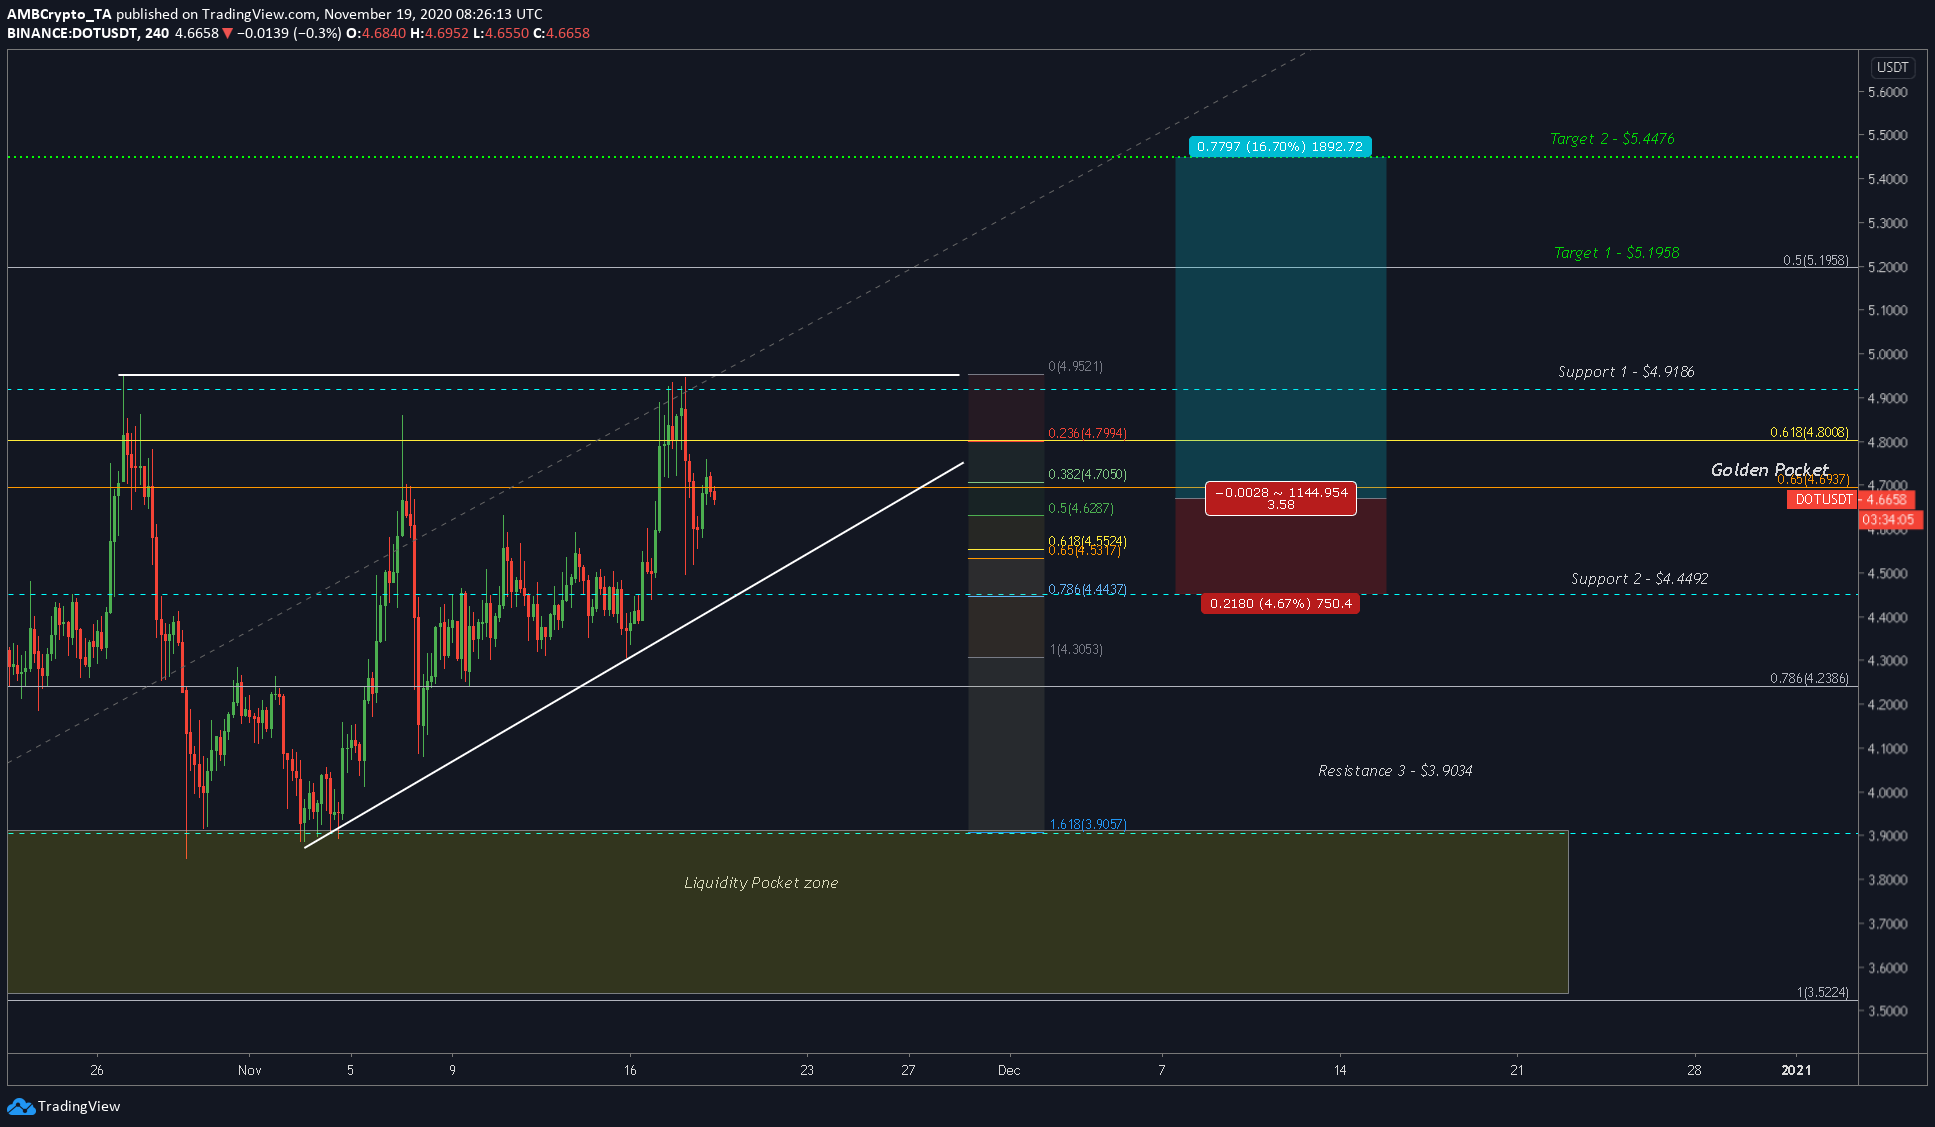
Source: DOTUSD TradingView
Dot’s performance has been splendid the past two weeks, and it seems it didn’t suffer as much due to bitcoin’s volatility as the other altcoins. For now, the outlook for Dot is extremely bullish on the long term [1-2 weeks], however, on a very short term time frame, we might see the price drop.
The worst part seems to be done as the price has moved away from the liquidity pocket.
Rationale
The reason for being bullish on Dot is the formation of an ascending triangle, which projects a bullish breakout soon. The price hasn’t reached the breakout point yet, hence, we will see Dot move in the pattern, slowly climbing higher.
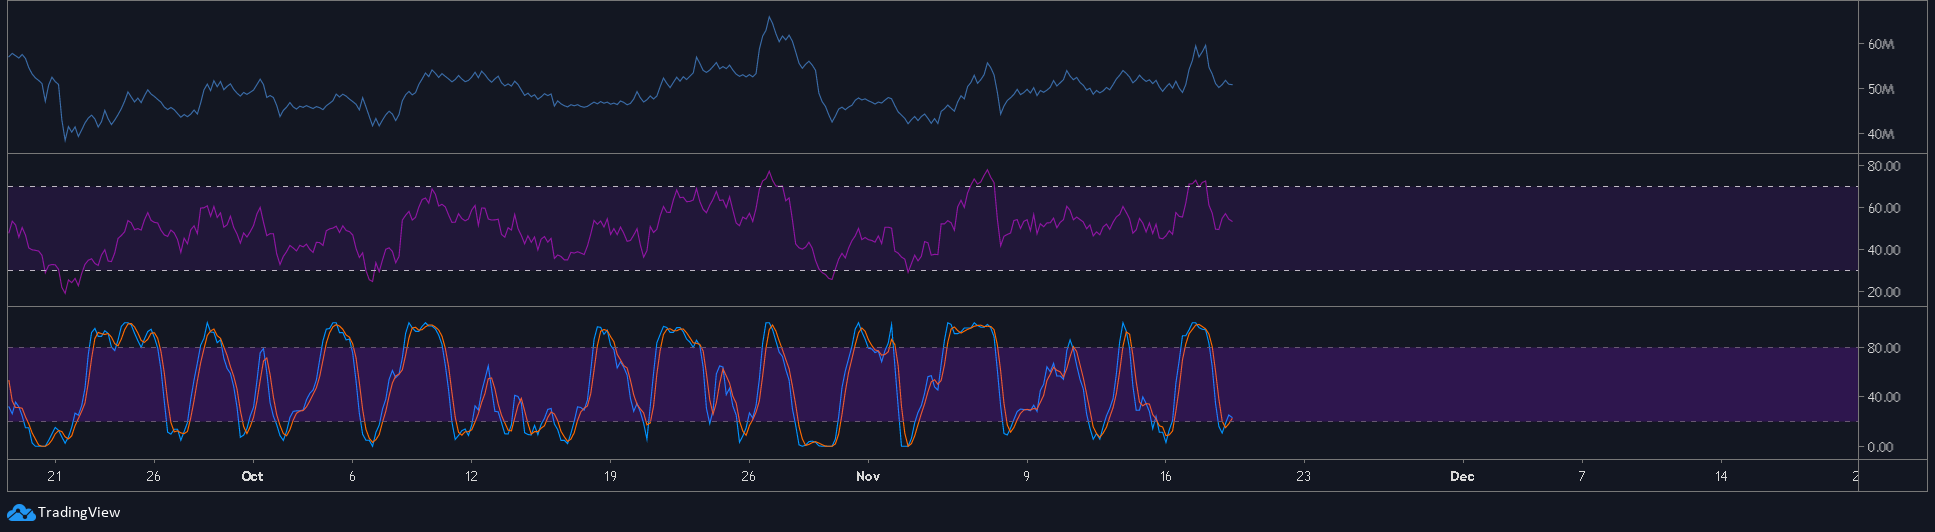
Source: DOTUSD TradingView
The above chart shows the Dots’ indicators and how they are all bullish, except the RSI. The Stochastic RSI showed a bullish crossover in place, however, RSI is trudging around the 50-level, which showed a chance to rebound higher.
The OBV is reacting to the price, hence, it isn’t particularly bearish or bullish.
Levels to lookout
Entry: $4.668
Stop-loss: $4.450
Take-profit: $5.198, $5.447
Risk-to-Reward: 2.42, 3.58
The price is finding its footing between the 0.382 and 0.5-Fibonacci level; any breach would push the price towards the lower trendline of the triangle to be only bounced back.
This long position will last from a couple of days to a week or two. So, patience is a must with this trade. An additional thing to keep in mind is the stop-loss, which could also be extended by a few ticks.