Polkadot long-term Price Analysis: 16 November

Disclaimer: The findings of the following article are the sole opinion of the writer and should not be taken as investment advice
Polkadot’s price surge took the industry by storm when it began in early September. Surging up to $6.89 in a matter of days, the crypto-asset locked in a position in the market’s top-5 in just over a month. However, since then, the crypto-asset has depreciated by a lot, slipping down to 9th on the charts. While a position in the top 10 is still commendable, the crypto-asset, at the time of writing, looked set to climb the ladder again.
Polkadot 1-day chart

Source: DOT/USD on TradingView
Polkadot’s price movements have been limited to the levels of $4.90 and $3.60 since 20 September. The volatility of its movement has been limited and a somewhat neutral trend has persisted on the charts, despite the fact that DOT did not register any significant movement other than re-testing the resistance at $4.90 a couple of times. Now, with a symmetrical triangle taking shape, the crypto-asset may finally attain another re-test, before breaching the range.
At the time of writing, the 50-Moving Average was acting as an underlying support for the token and the valuation was consolidating above the 0.382 Fibonacci line. The resistance at 0.5 is also legit, but it should be broken during the next rally.
Further, the trading volume has remained minimal over the previous month.
Market Rationale

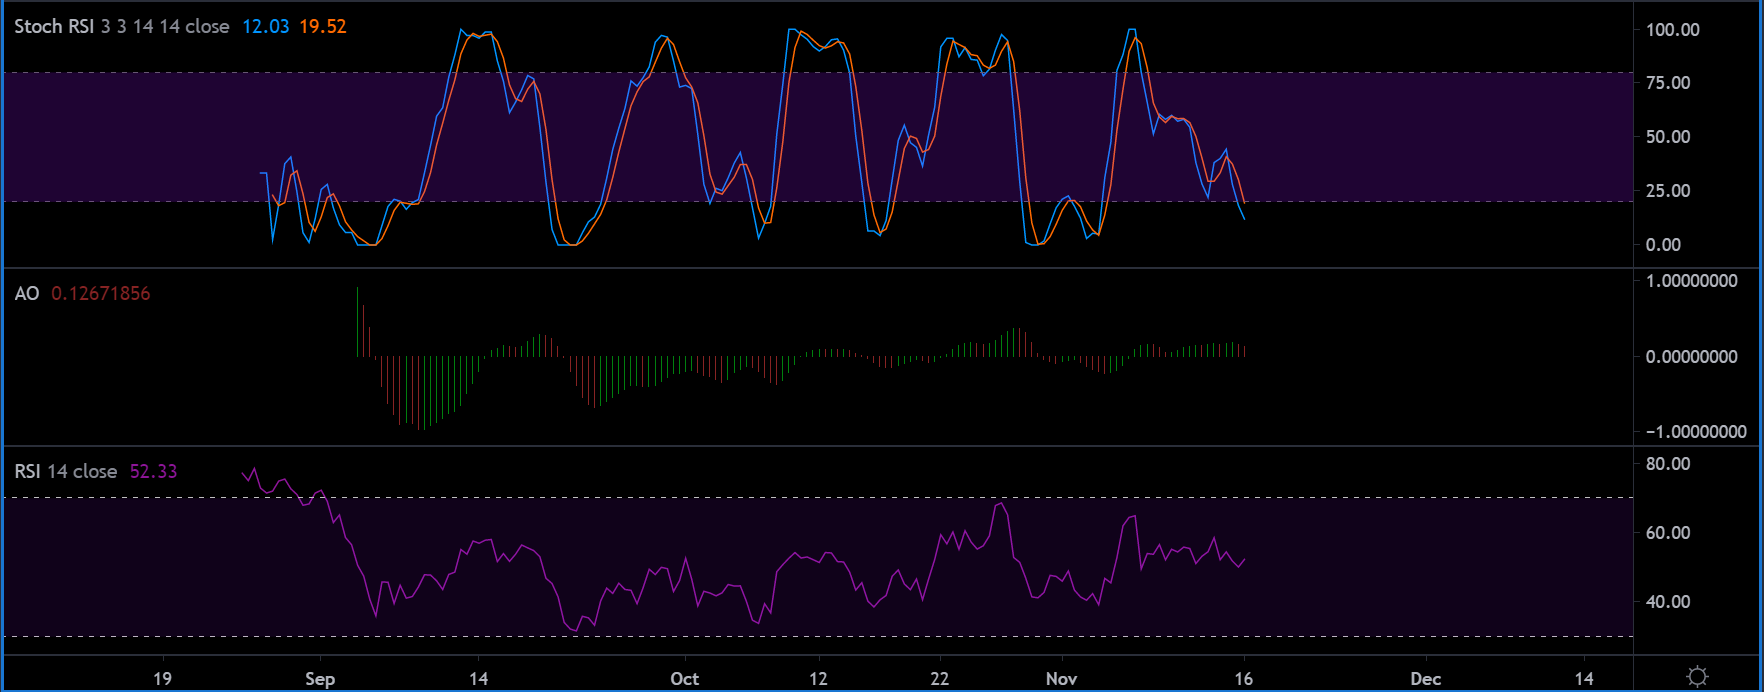
Source: DOT/USD on TradingView
The market indicators were a little contradictory, but the trend should become largely bullish over the next couple of weeks. The Stochastic RSI gave an upper hand to the bears, but it was fast approaching the oversold region. A reversal right after will allow the price to pump.
Also, the Awesome Oscillator or AO indicated the presence of neutrality and the Relative Strength Index or RSI suggested that the buyers were keeping the momentum bullish at the moment.
The key understanding is DOT’s sustenance at $4.00. It is essential that a closer consolidation around $4.90 is maintained, before breaching the price level in question.
Important Range
Resistance: $4.90, $4.76
Support: $3.60, $3.70
Entry Point for Long Position: $4.30
Stop Loss: $4.12
Take Profit: $4.76 or $5.00
Risk Reward Ratio: 2.56x
Conclusion
Polkadot’s present market trend is going to change over the next couple of weeks as it gears up to break away from its consolidation. While the trend was neutral at press time, the bullish signs were evident over the course of next month.


