![Polkadot [DOT] long-term price analysis: November 19](https://eng.ambcrypto.com/wp-content/uploads/2020/10/katie-mcnabb-8AJuvX4hzws-unsplash-1024x769.jpg)
Disclaimer: The findings of the following article are the sole opinion of the writer and should not be taken as investment advice
With the DeFi craze dying, DeFi coins seem to be really calm. DOT is sharing the same calmness, as its price has seen a 45+% retracement since September. For more than a month now, DOT has been slowing heading lower, with mini surges every now and then.
With Bitcoin hitting $13,000 and facing rejection, we may now expect the price to go sideways. This consolidation/distribution/accumulation, whatever it is, will give time and opportunity to altcoins like DOT to perform.
Optimistic about this is the formation of a bottom reversal pattern on DOT’s charts, a formation that pointed to big gains for the coin.
DOT 6-hour chart
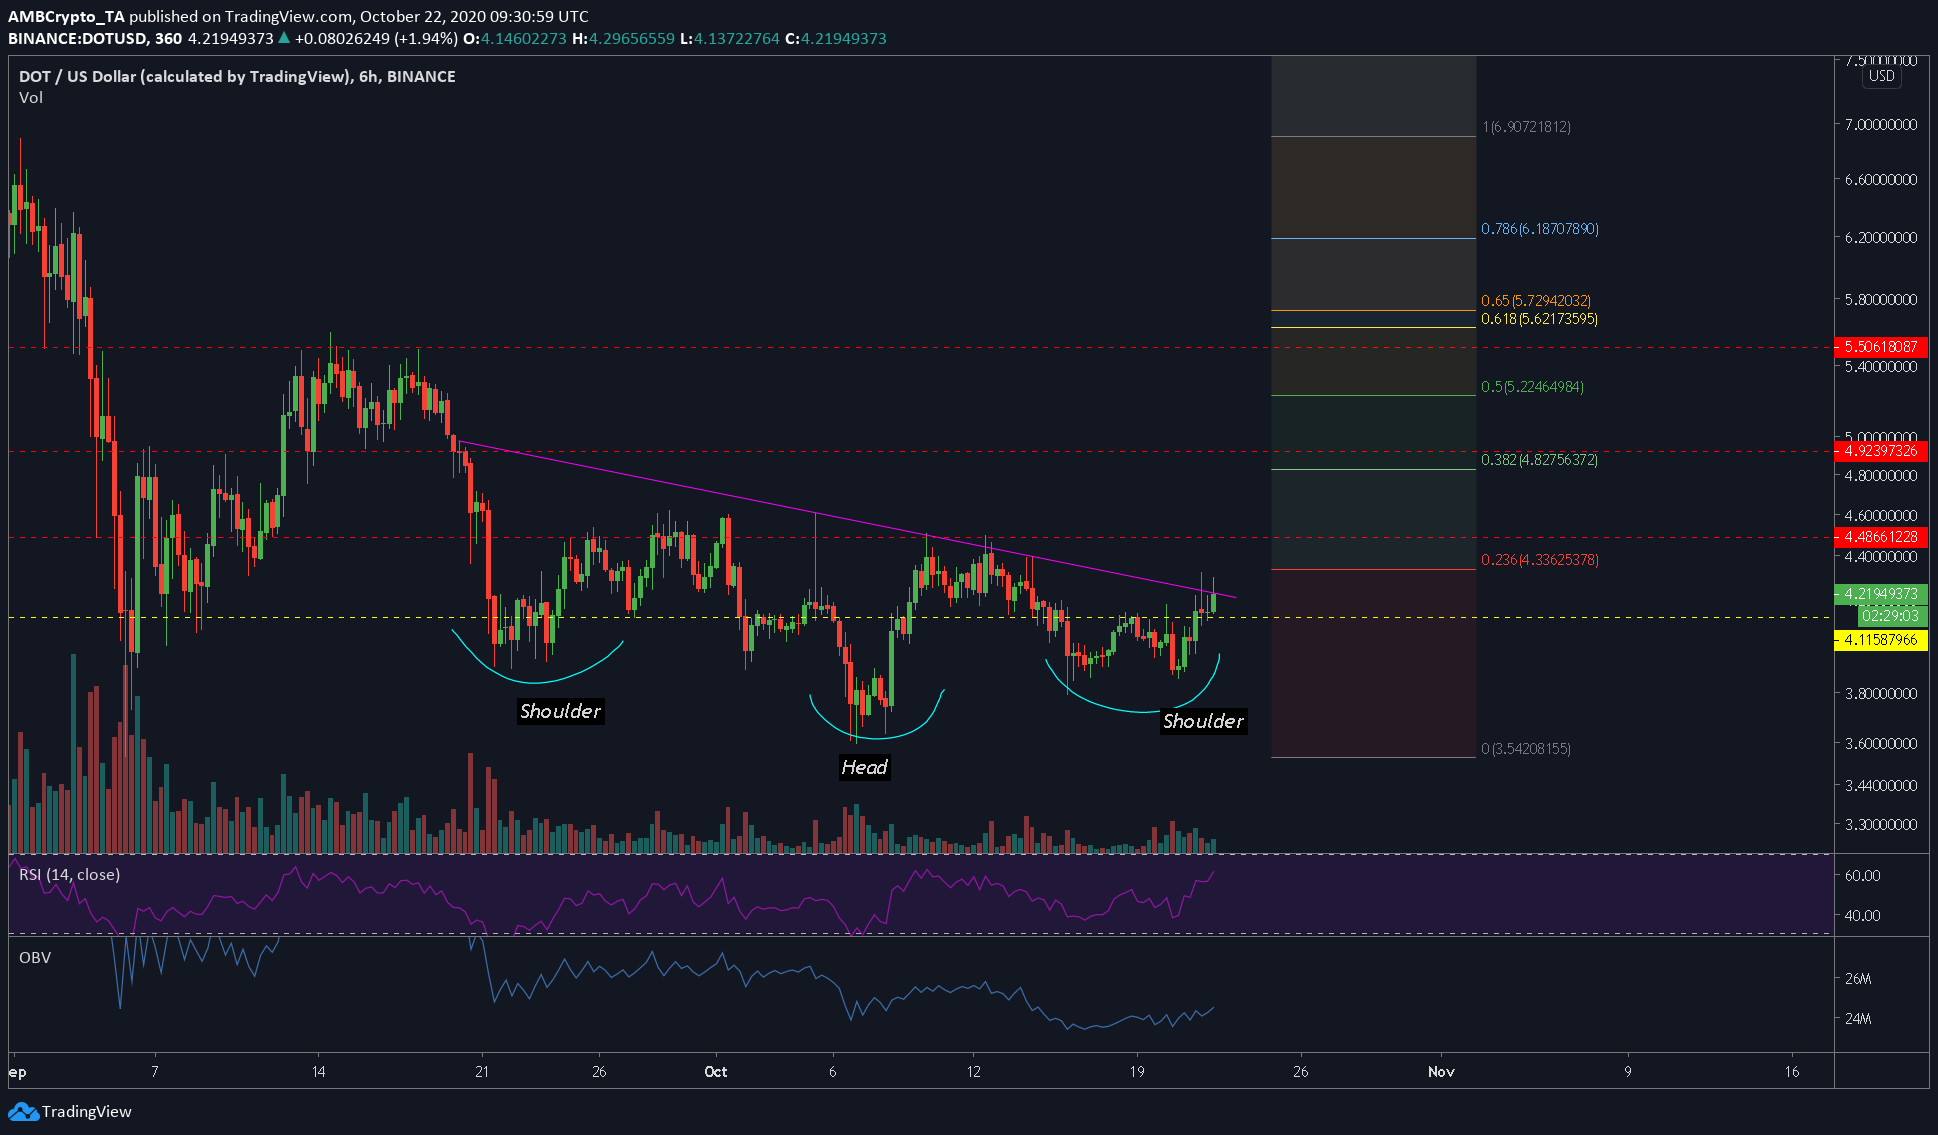
Source: DOTUSD on TradingView
A clean [potential] “head and shoulder” pattern seemed to be forming for DOT. The price was very close to the neckline [purple declining line], indicating that a breakout might be coming soon.
The performance of DOT can be hindered by the 0.236-Fibonacci level [aka $4.336], which, together with the neckline, will act as a single unit of resistance. Hence, should the price on the daily/six-hour timeframe close above these two levels, a long position would be the best way to go about it.
Crossing these levels, DOT’s potential targets include $4.486, $4.9, $5.22, a combination of resistance and Fibonacci levels.
Rationale
The rationale behind this long position [other than the obvious bullish head and shoulder pattern] are two: Bitcoin will surge higher and will take altcoins with it, Bitcoin will consolidate and allow altcoins to enjoy for a brief moment.
Additionally, the RSI has formed a bullish divergence on the right shoulder, a formation that seemed to help DOT’s case.
Levels to look out for
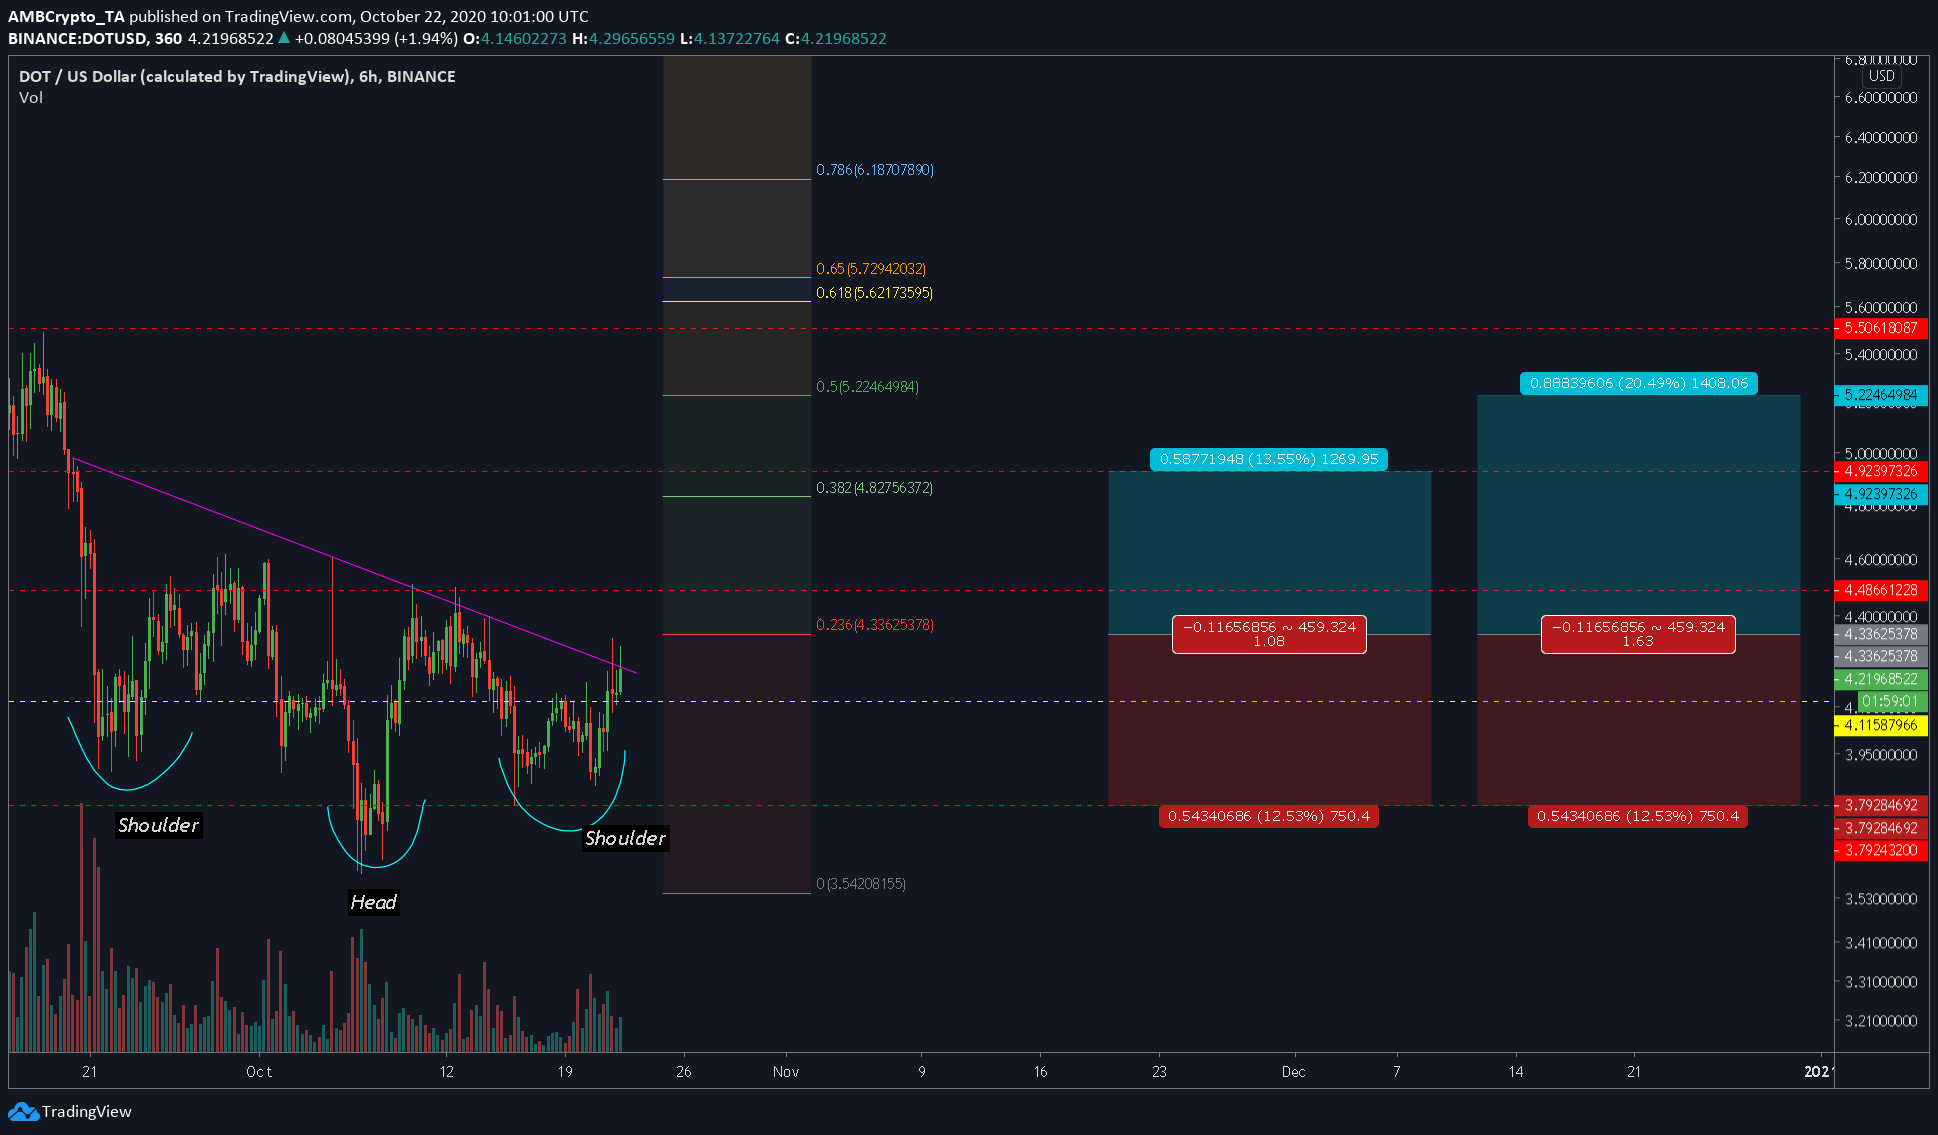
Source:: DOTUSD on TradingView
For a long position, these are the levels,
Risk-to-Reward: 1.08
Entry: $4.33625378
Take-profit: $4.92397326
Stop-Loss: $3.79284692
Risk-to-Reward: 1.63
Entry: $4.33625378
Take-profit: $5.22464984
Stop-Loss: $3.79284692