A breakout above a crucial resistance level, maybe is witnessed for Ontology soon. A rising valley formation was hinting towards a price rise in the short-term.
While for Polkadot the price action during the course of the day has been bullish. For Cosmos, the overall picture remained bearish with an eventual slide to its immediate support seeming likely over the weekend.
Polkadot [DOT]
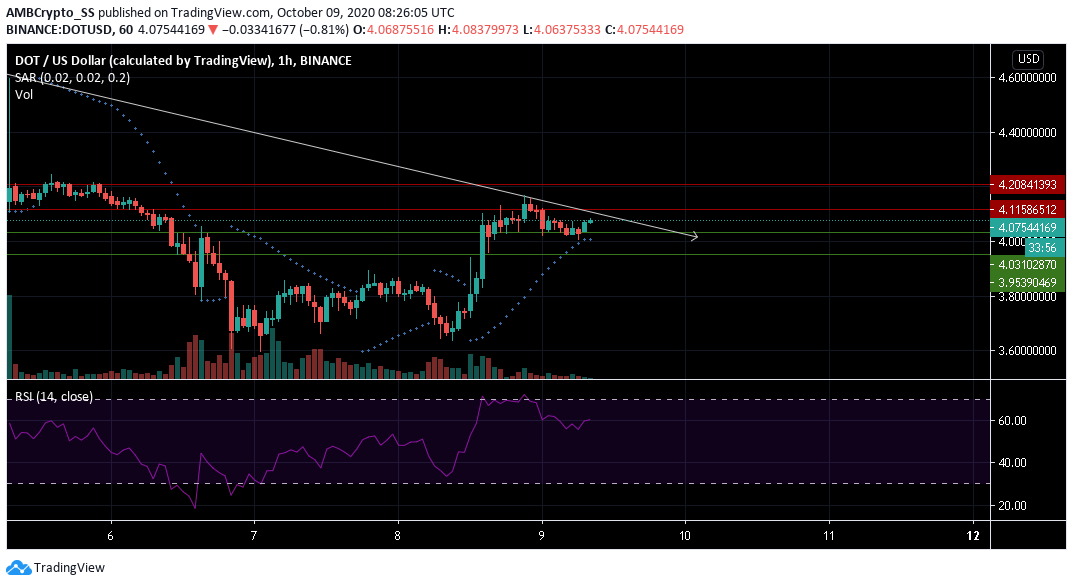
Source: DOT/USD on TradingView
Despite the presence of buying pressure, Polkadot traded within a tight range following another week of low volumes. At press time it was trading at $4.075
Seen making lower highs, the Relative Strength Index was just below the 60 level. The price, however, faced stiff downward pressure from the immediate resistance level of $4.11. The volumes were still not strong enough to maintain the bullish momentum.
The presence of the dotted lines of the Parabolic SAR below the candles also underlined a scenario of an upcoming uptrend.
In other news, Polkadot revealed ‘initial parachain offerings’. This would help it scale transactions across numerous blockchain shards via such parachains.
Cosmos [ATOM]
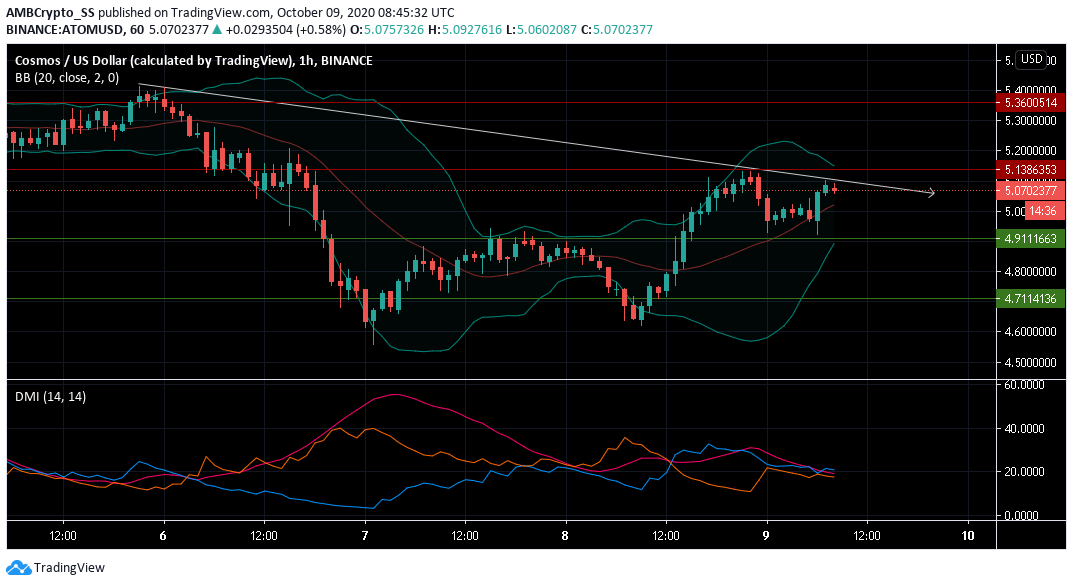
Source: ATOM/USD on TradingView
Down by 1.5% since yesterday, Cosmos at the time of writing was seen trading at $ 5.07. The Directional Movement indicator underlined a mixed-signal, as the DMI trend lines remained convoluted.
As volatility remained low, readings of the +DMI (blue) slightly above the -DMI (orange) in a bullish signal, should be dealt with caution. Further signaling low volatility levels for the next few trading sessions, the Bollinger bands were also seen contracting.
As a result, a price consolidation between the support and resistance levels of $ 4.911 and $ 5.138 remained a likely scenario.
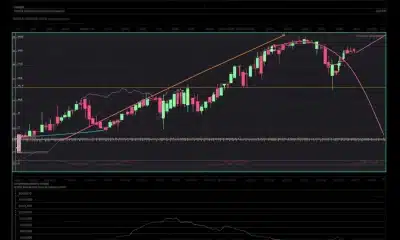
Ontology [ONT]

Source: ONT/USD on TradingView
The digital asset may witness a rising valley formation on the charts. Ontology bulls also managed to take good control at the $ 0.574 resistance level.
The MACD’s bearish scenario still suggested drop in price. Between the support and resistance levels of $0.56 and $0.57, prices could be constricted, as per this alternative scenario. A strong presence of bulls may further aid this scenario.
The Relative Strength Index supports the likelihood of a rise in buying sentiment. If this holds true, a breach above the current resistance might take place in the next few trading sessions.