
The ongoing bearishness in the market has confined the Litecoin bulls below the $35-range. At press time, the silver coin was priced at $33.18, meaning it had lost nearly 47% of its value from its 2020-high.
LTC 4-Hour Chart
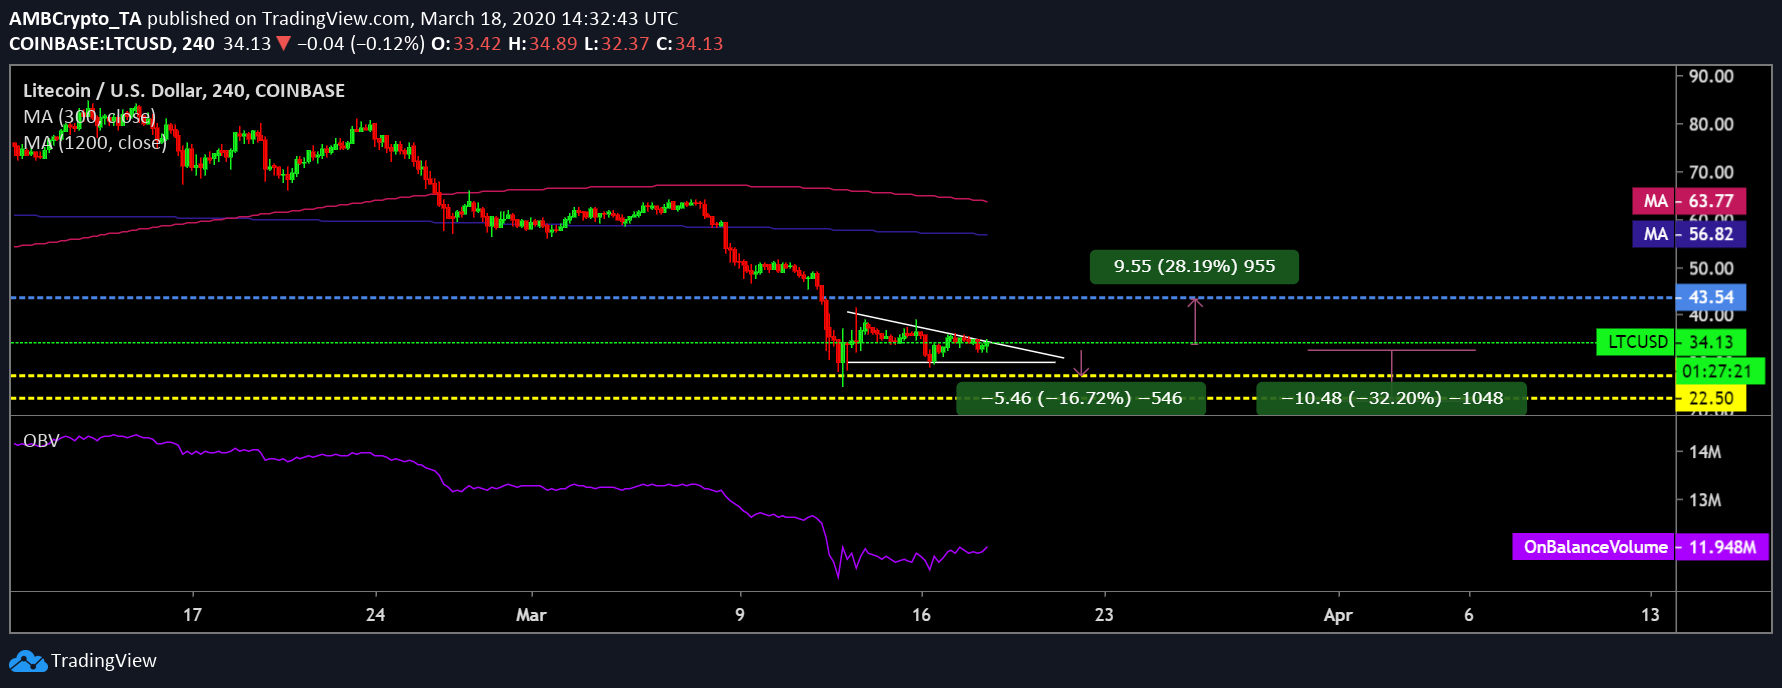
Source: LTC/USD on TradingView
Following several market corrections, LTC bulls have been trapped in the descending channel pattern which took shape from 13 March, a shape that still holds form even today. The price candles found themselves severely resisted by the downward sloping line of the pattern, and the formation of this channel on LTC’s 4-hour chart was indicative of a bearish breakout for the coin in the near-term.
The end of Golden cross imminent?
Even the moving averages appeared to be favoring the bears. The 50-daily moving average [Pink] and the 200 daily moving average [Blue] underwent a golden cross on 18 February. This trend has continued throughout numerous corrections for Litecoin. However, the gauge that widened till 8 March now hints at a trend reversal.
Since 12 March, the gauge has been declining steadily, with the 200 daily moving average being consistent while the 50 daily moving average closed in gradually. This could potentially hint at a death cross lurking in the near future, with the 50 moving averages falling below that of 200.
Further, the OBV indicator has followed Litecoin’s price movements. It surged to $14.35 million in mid-February and then fell sharply, mimicking the price action of the coin. At press time, the On Balance Volume indicator suggested high sell-volumes, a finding that projected a fall in price in the near future as cumulative volumes continue to fall.
Target Points
With bears weighing in, the silver coin could find itself test the lows near $27.43, a level not seen since January 2019. A further decline and a breach of this level would mean sliding down to the next support at $22.5; this level was last seen in mid-December 2018.
However, in an unlikely scenario of a bullish breakout, Litecoin’s price could be resisted at $38.05 and $43.54 levels.
Correlation
Litecoin is often touted as the “silver to Bitcoin’s gold”. It not only shares the same codebase, but both crypto-assets have also seen similar price movements historically. As Bitcoin remains the undisputed leader of the cryptocurrency realm, all the other altcoins recorded a high correlation with the king coin and the silver crypto is no different.
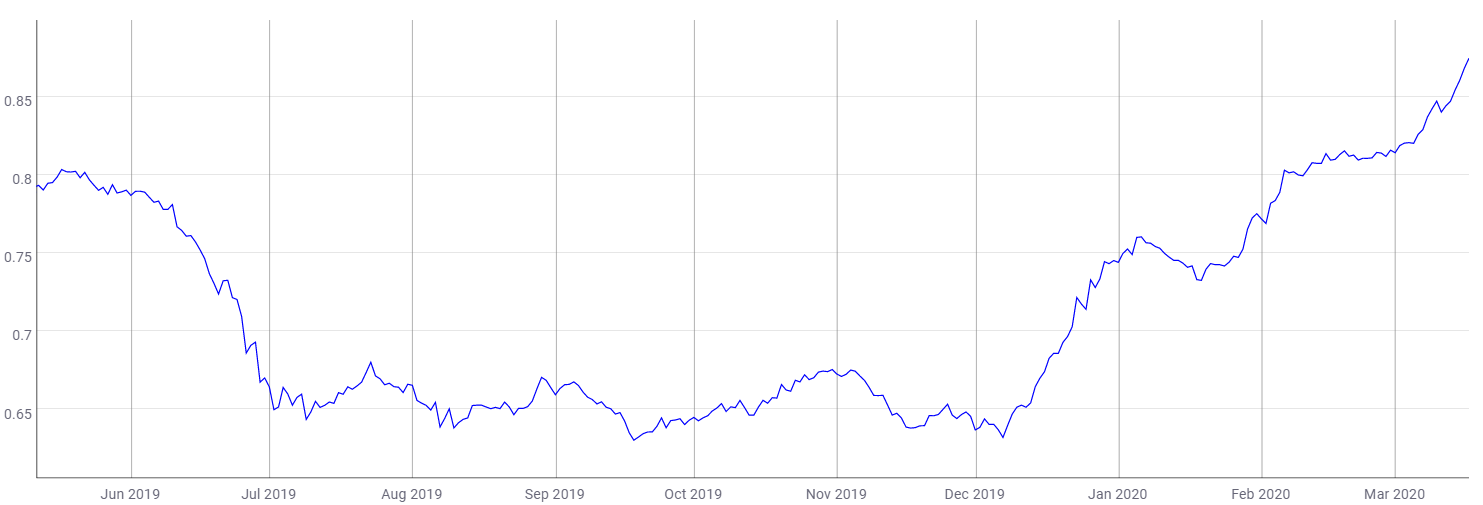
Source: LTC/USD on TradingView
Over the last three months, the correlation between these two crypto-assets has increased. As of 17 March, the correlation stood at 0.87.
Conclusion
While the descending channel indicated a bearish breakout in the short-term for Litecoin, the OBV indicator also indicated a sell-off sentiment among LTC investors. With strong bearish projections, the coin could potentially find itself tested at $27.43, meaning a drop of over 16%; continuation of this trend could lead to a drop to $22-level.