Litecoin, VeChain, Algorand Price Analysis: 12 August

Litecoin, VeChain and Algorand have all tested important short-term supports. VeChain looked poised for more gains. Algorand looked likely to move upward, while Litecoin broke below support and would look to maintain the psychological $50 level as well.
Litecoin [LTC]

Source: LTC/USD on TradingView
Litecoin had a 24-hour trading volume of $2.6 billion. Ranked 8 in terms of it market cap of $3.5 billion and registered a 24-hour trading volume of $2.5 billion. David Schwartz of Litecoin Foundation tweeted that Litecoin had more active wallets than Bitcoin Cash and Bitcoin SV combined.
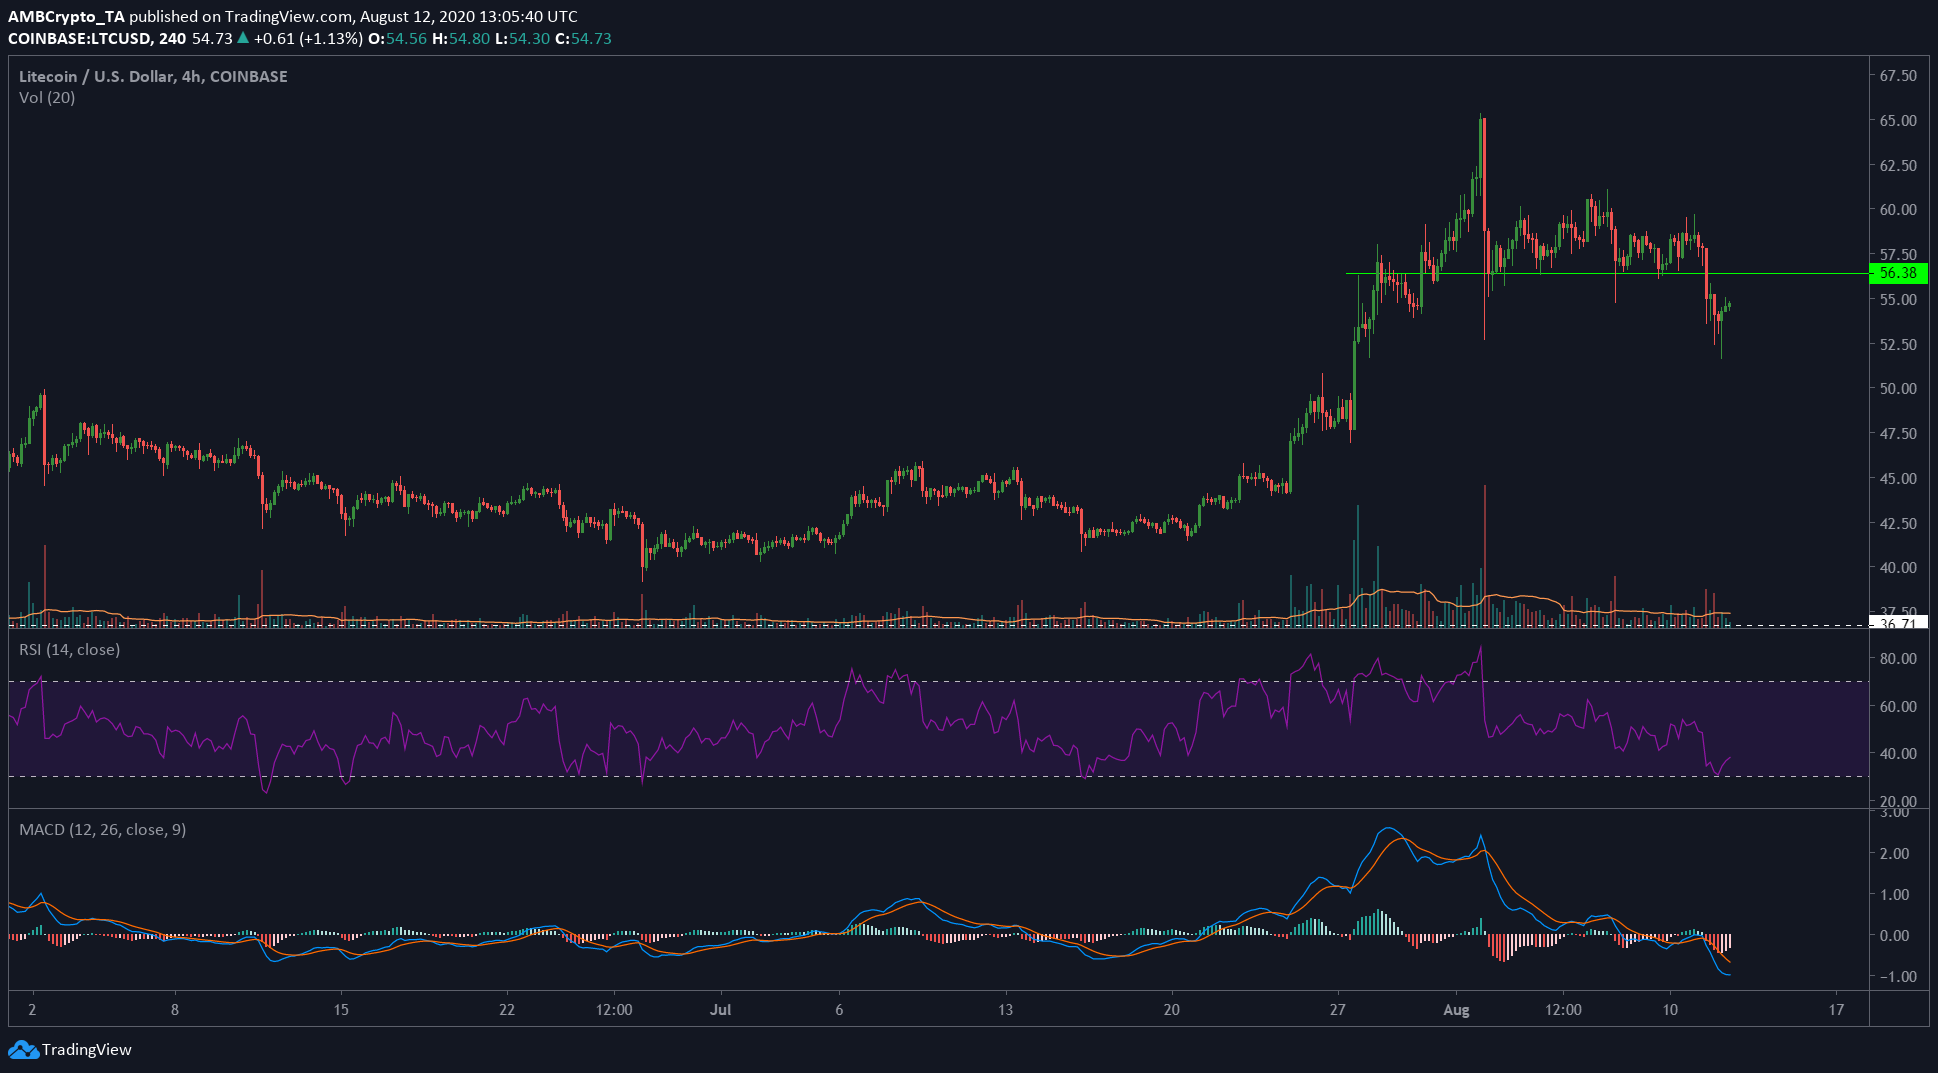
Resistance region near $56 was flipped into support towards the end of July. In the past couple of days, this support flipped back into a resistance. The MACD crossed over to give a sell signal during the last move downward. With RSI value at 36.6, LTC is near the oversold region. For the past few days, RSI values have floated beneath the value of 50-indicating a correction from the gains of last month. Unless the $56 level is flipped, Litecoin traders would consider the psychological $50 as the next important level.
VeChain [VET]

Source: VET/USDT on TradingView
VET was one of the best performing alts among USDT-Margined contracts traded on Binance in July. It was ranked 19 with a market cap of $1.1 billion at press time.
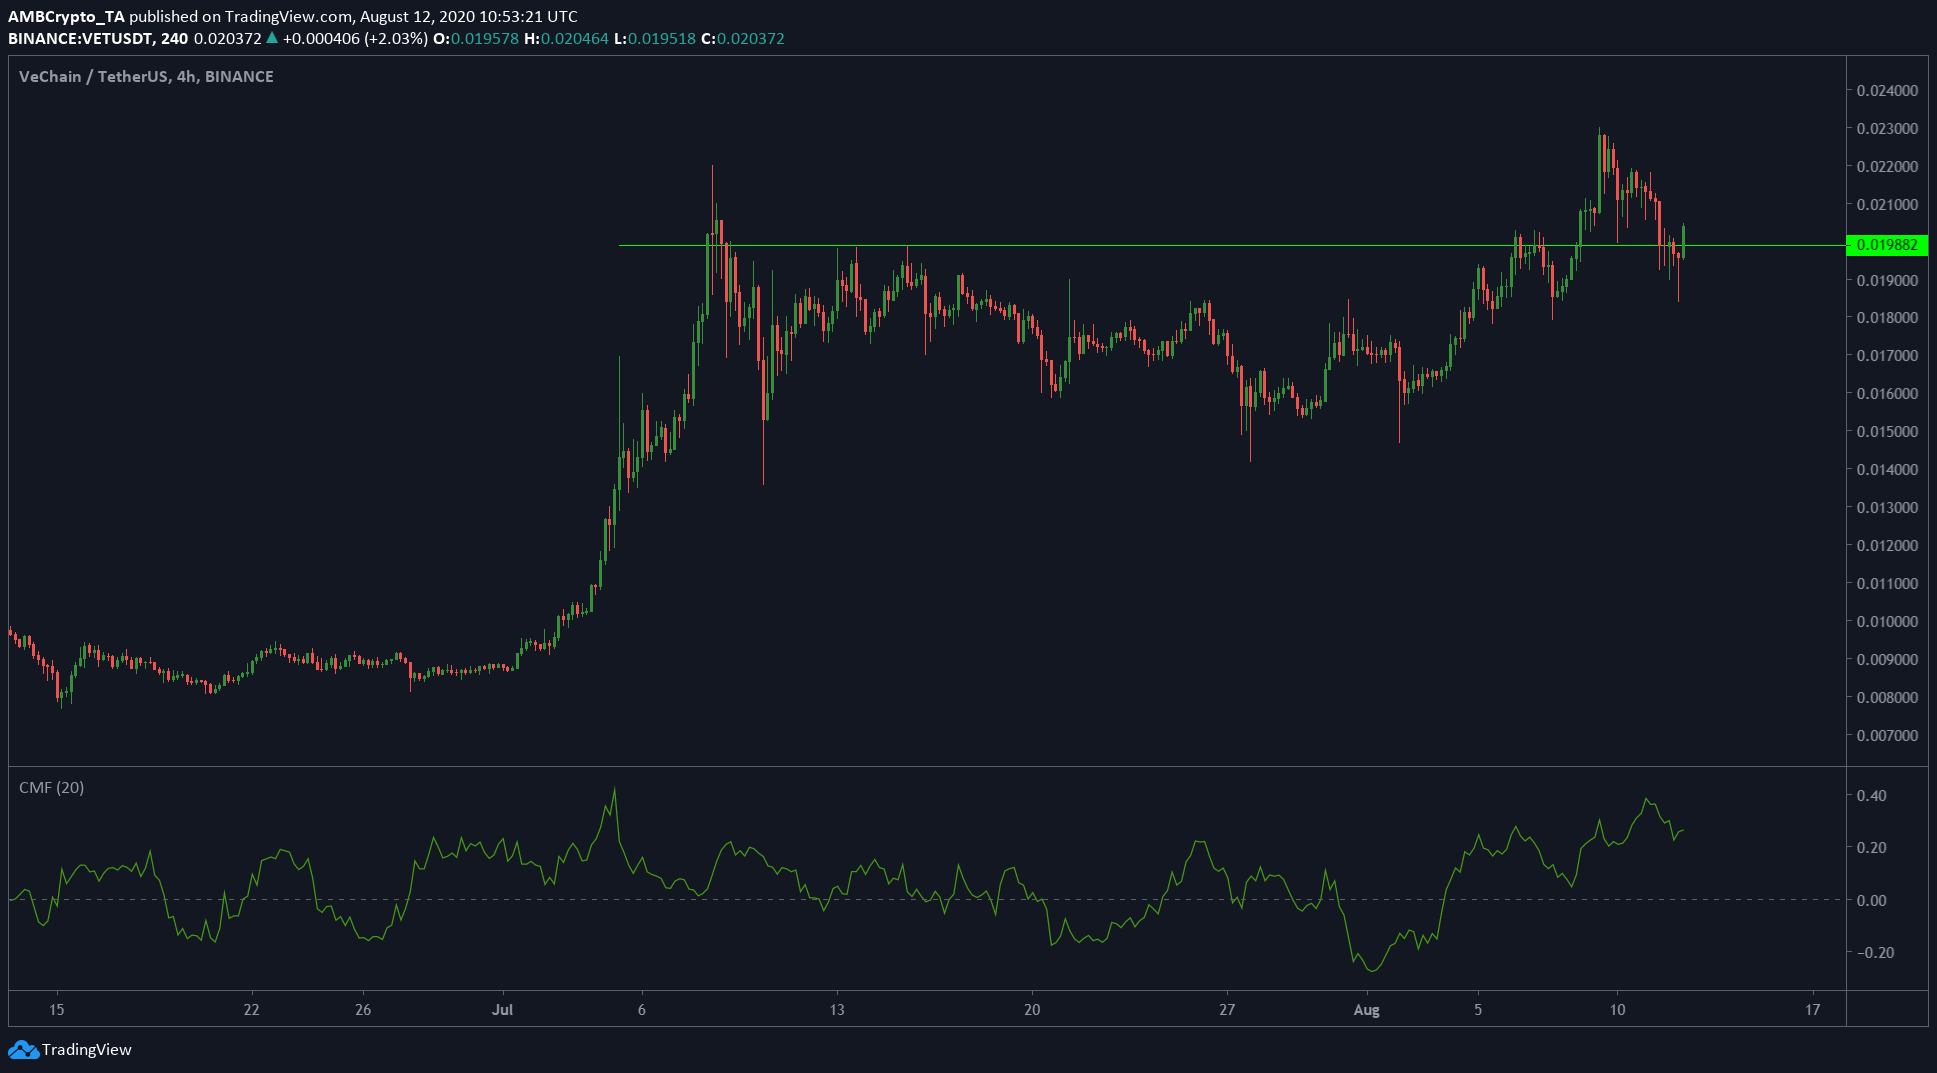
The region near $0.0198 acted as resistance for a month. It was breached and retested in the past few days. CMF indicator showed money flowing into the market. This can be evidence for another leg upward for the price. Since the wicks of the past few candles were long, the inference may be the existence of good buy pressure below the support. In all, the likelihood of VET price advancing can be observed.
Algorand [ALGO]

Source: ALGO/USD on TradingView
ALGO has a market cap of $345.1 million. Last week, Borderless Capital announced a partnership with Algorand, and this was reflected in price movement.
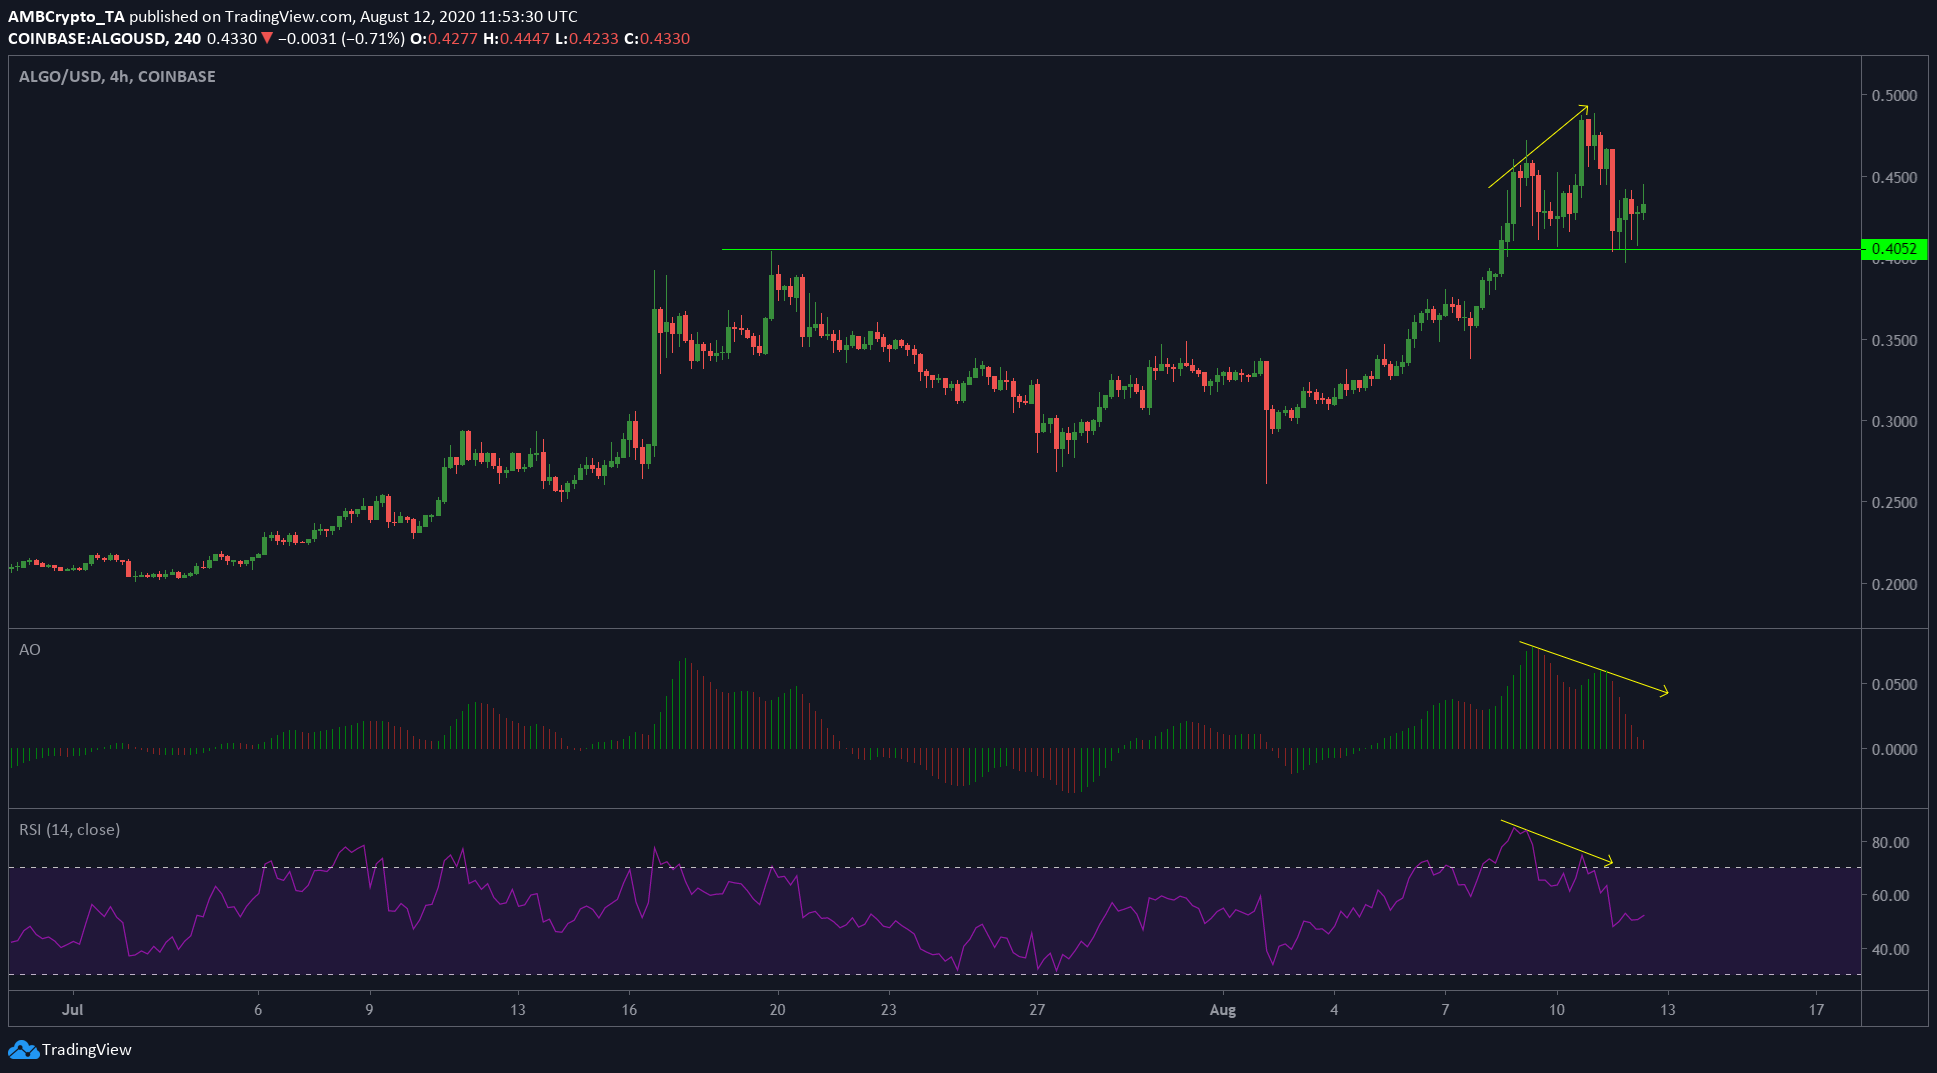
Over the past few days, ALGO showed a bearish divergence. The price of the coin made higher highs while the Awesome Oscillator made lower highs. Similar bearish divergence is seen with RSI as well, and the price proceeded to take a dip and tested support at $0.4. Support did not break, and RSI did not go under 50 for long. Generally, sustained RSI values above 50 are indicative of uptrend.

![Reasons why Litecoin [LTC] investors should be concerned](https://engamb.b-cdn.net/wp-content/uploads/2023/12/ambcrypto_A_Litecoin-themed_scen-400x240.png.webp)


