Litecoin short-term Price analysis: 14 November

Disclaimer: The findings of the following article attempt to analyze the emerging patterns in Litecoin’s short-term market and its impact on the price
The value of the cryptocurrency popularly dubbed “digital silver” received a boost after it climbed from $58 to $66 in a matter of hours. In fact, Litecoin’s price, for a while, had been moving sideways on the charts, despite Bitcoin’s own rally. However, this trend changed over the past few days. While LTC’s market did face a wave of corrections soon after, the last few trading candles on the hourly chart did point to some bullish resistance.
At the time of writing, the cryptocurrency ranked 7th on CoinMarketCap’s charts was being traded at $64.40.
Litecoin 1-hour chart

Source: LTC/USD on TradingView
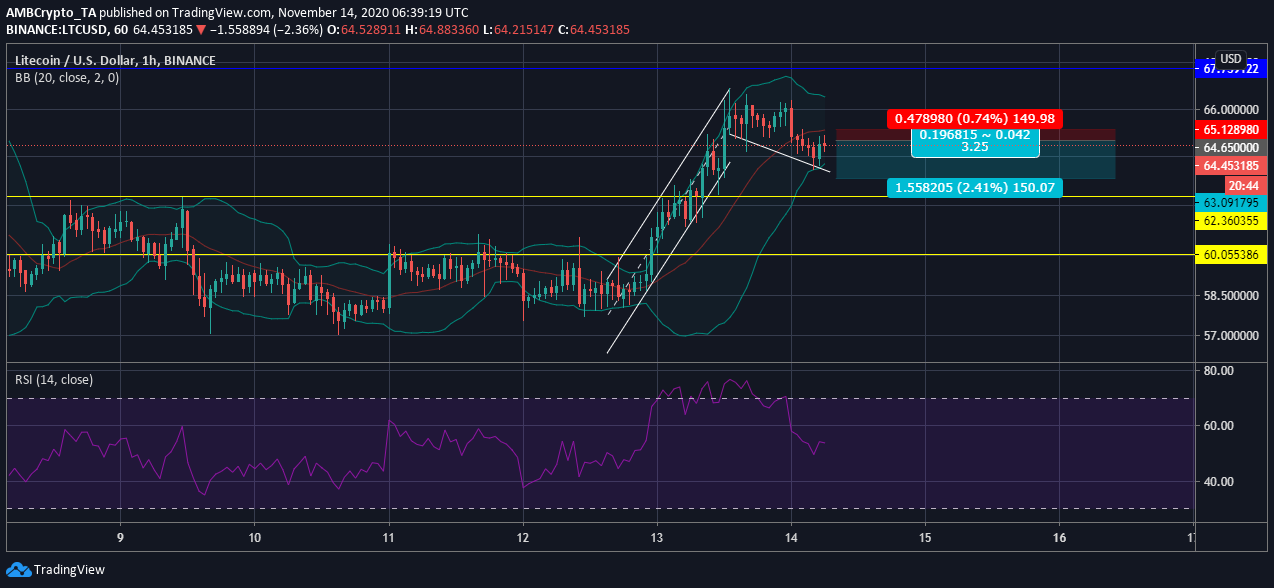
According to Litecoin’s hourly charts, the cryptocurrency was trending downwards over the past few hours, a development that can be inferred to be a breakout from the ascending channel. Even though the formation of the ascending channel was looked at as a bullish trend for the digital asset, the following correction has reversed this trend.
With the cryptocurrency’s price slipping on the charts, this could be the best time to enter a short position.
Reasoning
A significant degree of selling pressure was forming as the crypto-asset broke out of the long consolidation phase and surged. This gave traders the opportunity to make use of the correction profit.
This aforementioned selling pressure was highlighted by the Bollinger Bands as the indicator was still highlighting existing market volatility. Further, the Signal line took a position above the price candles – A sign of the price trending lower.
The Relative Strength Index also registered the sudden surge in price as it was pushed into the overbought zone. As the value dropped, the RSI also trended lower. At the time of writing, it was closer to the equilibrium level, wherein the buying and the selling pressures were equalized.
Positions
Entry: $64.65
Stop-loss: $65.12
Take-profit: $63.09
Risk-to-reward: ~3.25
Conclusion
Litecoin’s price chart highlighted the evolving selling pressure in the market. Here, traders can take advantage of LTC’s falling price by entering short-positions and making a profit at $63.09, a support level that might be tested soon, given the market performance.


