
Disclaimer: This analysis will attempt to foresee changes in Litecoin’s price charts for the 9th of June
Litecoin has been declining in value for the last two weeks. Along with upward break patterns, several pullbacks were also noted during this time. After a major drop on the charts on the 2nd of June, Litecoin’s price was observed to be trapped below the $48-mark. However, a breakout close to it could be in the offing.
Litecoin 4-Hour Chart
Source: LTC/USD on TradingView
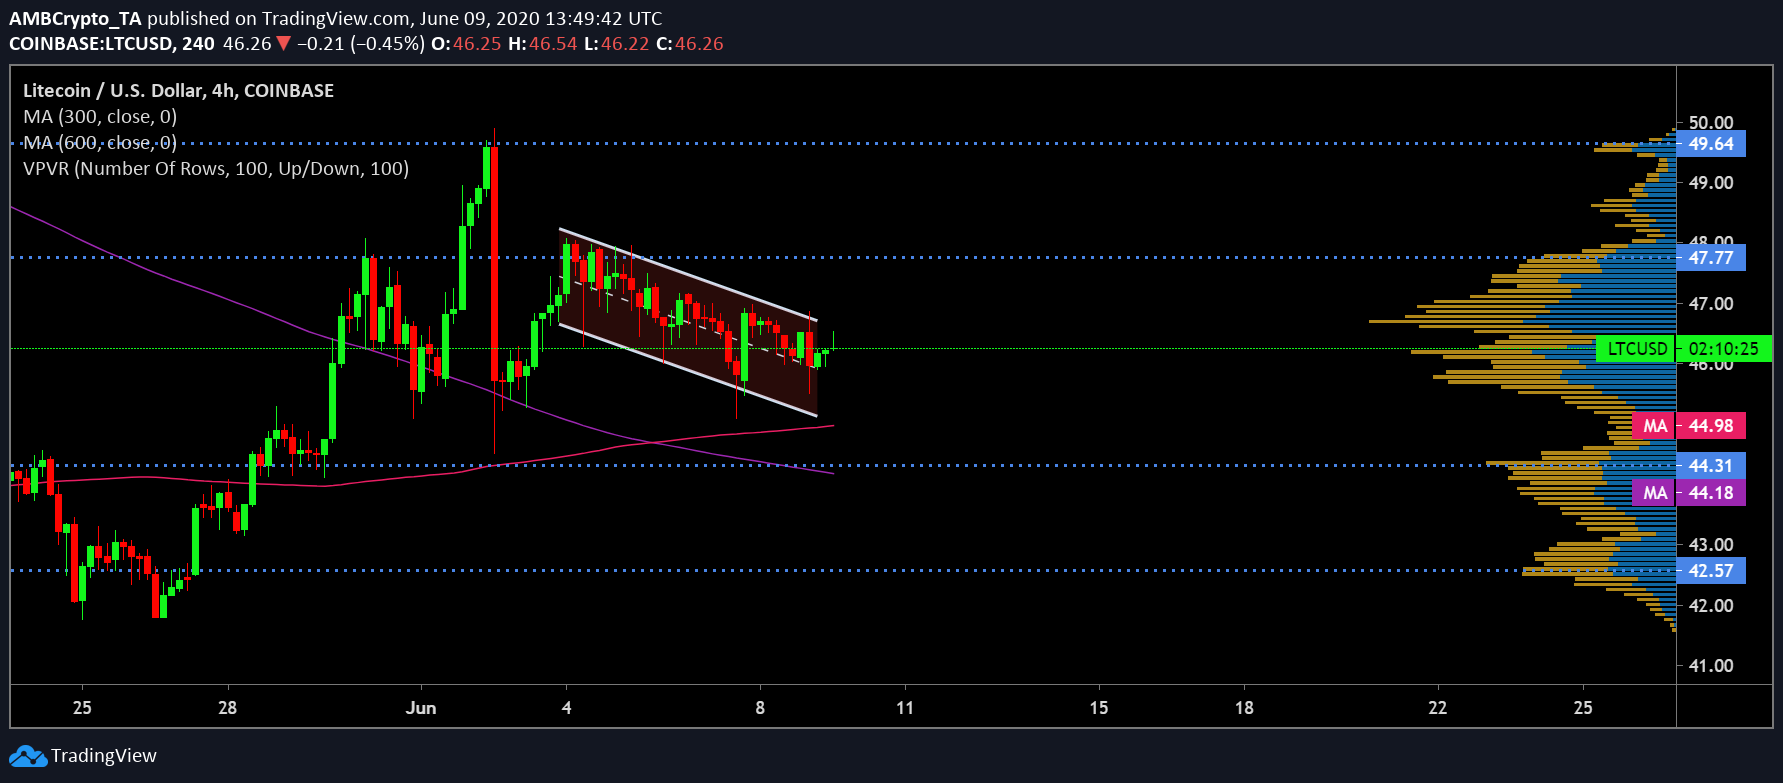
Litecoin’s short-term chart formed a descending channel pattern with the price candles oscillating between two downsloping trendlines. Completion of this pattern could potentially materialize in the form of a bullish breakout.
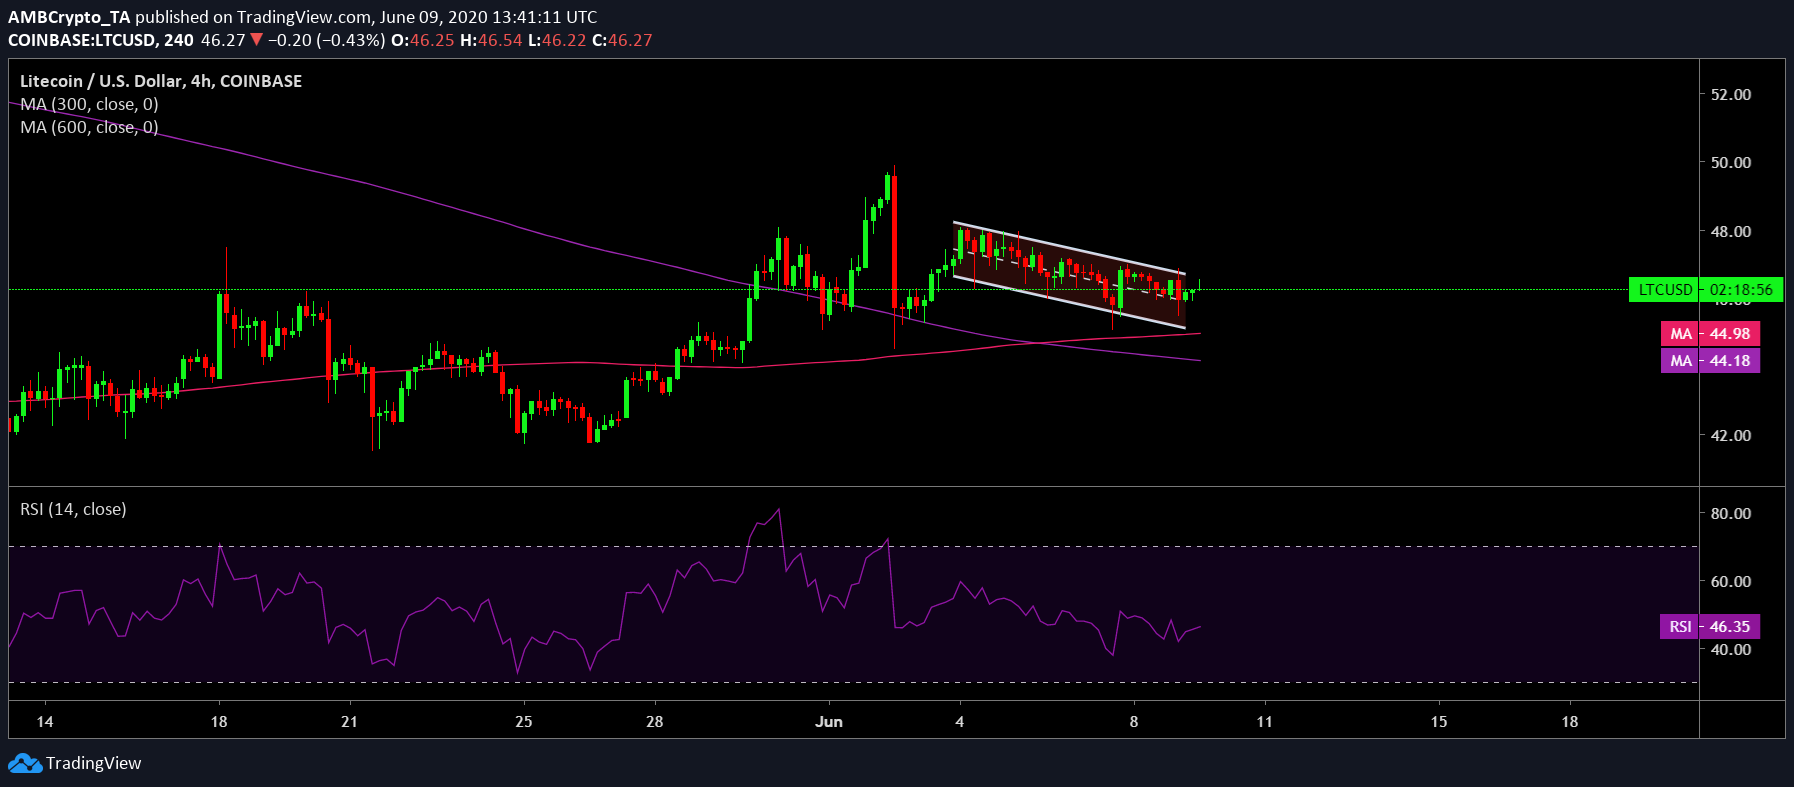
This was further validated by the placement of the two daily moving averages. The 50 DMA [Pink] and the 100 DMA [Purple] underwent a bullish crossover in the first week of June. The gauge since then has been on the rise. This depicted the continuation of a bullish phase for the coin. In addition, another positive sign for Litecoin’s value was that both the daily moving averages were below the candles, forming crucial supports points for the coin.
Source: LTC/USD on TradingView
The Relative Strength Index also exhibited a minor positive spike in investors’ outlook. At the time of writing, the RSI was noting a mild uptick, despite hovering below the 50-median line. This was indicative of rising buying sentiment among the investors in the Litecoin market.
If a bullish breakout takes shape, Litecoin could climb all the way to $47.77. If the uptrend gains necessary momentum, it could also target another resistance point at $49.64. A prospect of a bearish breakout appeared highly unlikely as the coin found significant support from the two moving averages, as well as at $44.31 and $42.57, levels that have seen high trading activity as depicted by the VPVR indicator.
Correlation
Source: Coin Metrics
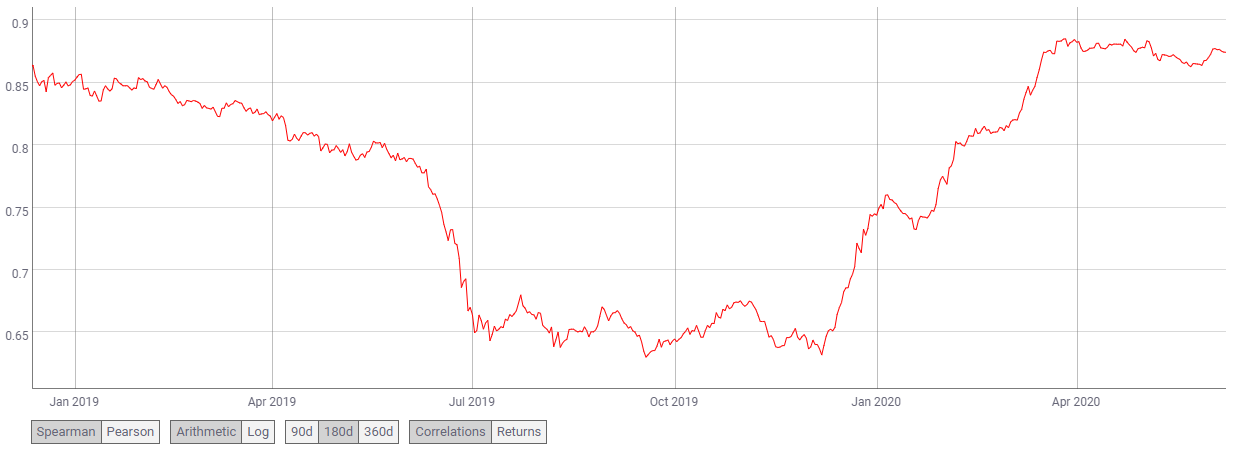
At press time, the BTC-LTC correlation coefficient stood at 0.874. Litecoin not only shares Bitcoin’s codebase, but is also highly susceptible to Bitcoin’s price swings in either direction. If Bitcoin manages to surge in the near-term, Litecoin’s price could find itself swayed in a positive direction.
Conclusion
The possibility of a bullish breakout was supported by the formation of descending channel pattern, the moving averages, as well as the latest uptick in the RSI indicator. In this case, the coin could potentially climb all the way to target points at $47.77 and $49.64.