
In the past few days, Bitcoin saw a minor movement which had a considerable influence on the altcoin markets. Many coins behind Bitcoin on the coin-ladder have seen isolated swings, one among them is Litecoin, the silver to Bitcoin’s gold.
Over the past two days, LTC has surged by over 7.3 percent, defying its short term chart-patterns. However, despite the swiftness of the rise, or maybe because of it, its rally isn’t going to last, and is now showing signs of weakness. Given how temporary altcoin pumps and dumps are, the LTC market should be wary this does not backfire.
At the beginning of the week, on 6 July, Litecoin was priced at $41.2, and in just over 24 hours, the price surged to $44. Two things happened as a result of this, the ascending triangle, which was in position since 27 June broke, and the resistance line at $43.31 was left behind, as the price soared. The price eventually tapped out at $44.4, just short of the next resistance at $44.67.
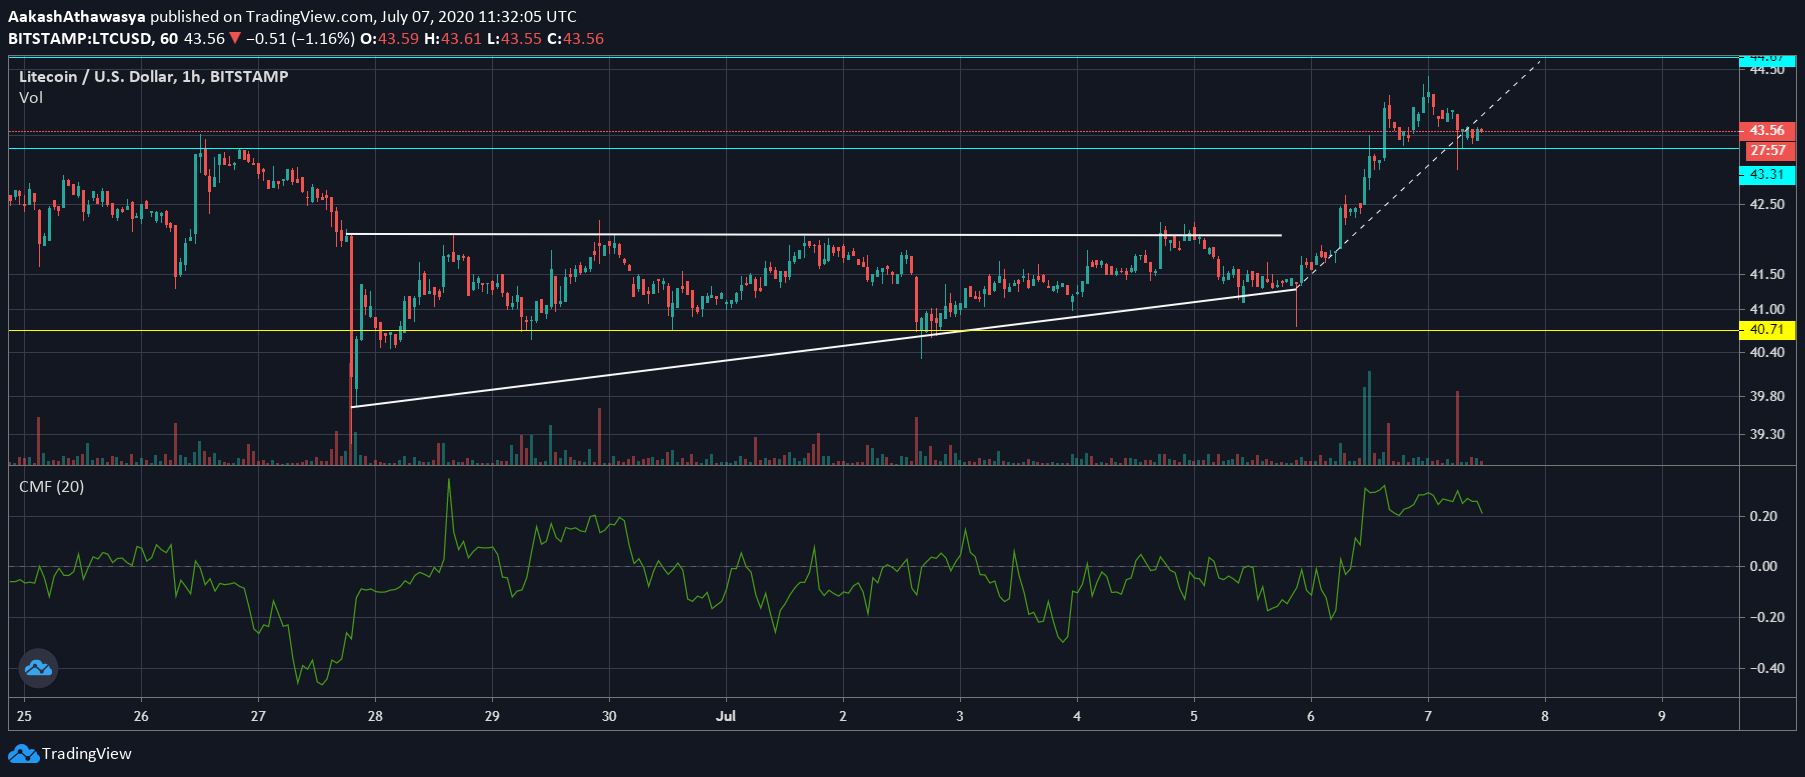
Litecoin hourly chart | Source: LTCUSD via Trading View
The last time LTC was trading this high was on 20 June, following which it dropped to a low of below $30. From this low, the price began to rise slowly, forming the same high never above $42.04, but consistent higher lows at – $40.55, $40.92, and $41.16, prolonging this ascending triangle, before the breakout on 6 July sent the price soaring.
On charting a trend line on the basis of this breakout, one can observe that it has already been broken. In order for Litecoin to sustain the unlikely massive pump, it should have continued to trade at or above $43.75, but its press time price of $43.6 has already dropped below it. Although in the hourly-chart the past three hours have had more green than red candlesticks, they have been outside the trend line, which albeit was difficult to sustain.
Even the 4-hour chart points to the same story. A breakout from the ascending triangle, owing to a massive pump, which cannot sustain the momentum generated and now is falling out.
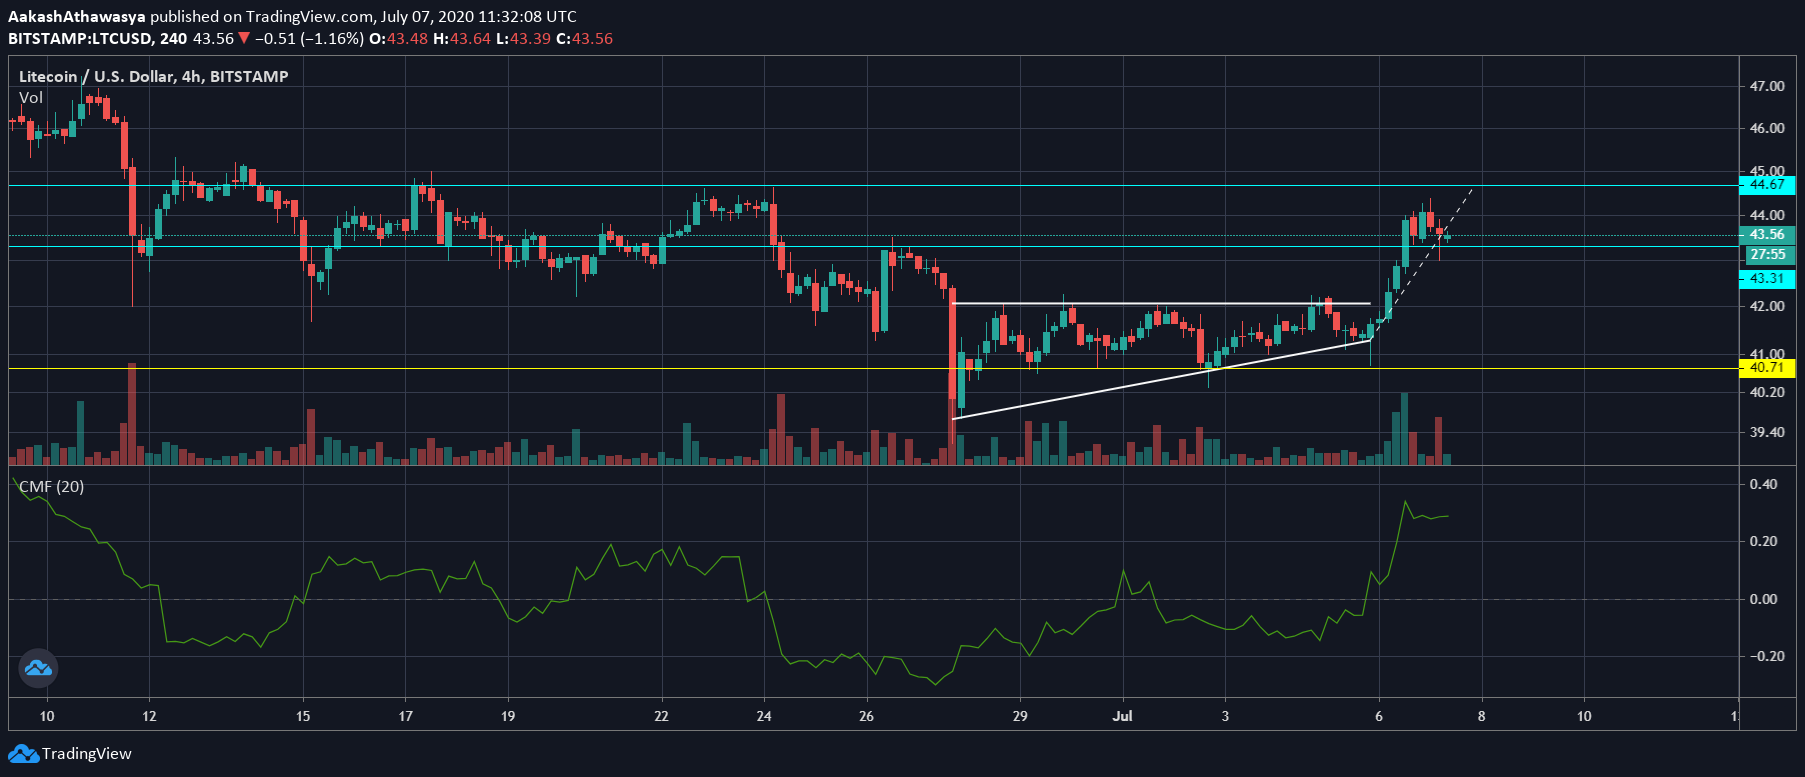
Litecoin 4-hour chart | Source: LTCUSD via Trading View
The Chaikin Money Flow indicator unsurprisingly shot up to a high of over 0.3, as LTC saw massive trading volume. According to CoinMarketCap, the 24-hour trading volume of Litecoin was close to $1.7 billion on 6 July. Since reaching that high, it has gone down to 0.23. Given that prior to the pump, LTC’s CMF was below o and as low as -0.2, a pullback could eject a lot of money from the Litecoin markets.
As things stand with the altcoin trading for just around $43.6, support level at $43.31 will be key, if held the price will likely sustain. If not, if a pullback is accompanied by high volume a drop to the lows of $41 can be expected.
![Reasons why Litecoin [LTC] investors should be concerned](https://engamb.b-cdn.net/wp-content/uploads/2023/12/ambcrypto_A_Litecoin-themed_scen-400x240.png.webp)