Litecoin, Polkadot, FTX Token Price Analysis: 02 November

Bitcoin, the world’s largest cryptocurrency, dropped from $13,750 to as low as $13,440 on the charts, with BTC trading at $13,561, at press time. Litecoin, on the contrary, was trading within a range, while Polkadot was in an accumulation phase. FTX Token saw some volatility over the past few days and noted some losses, with the crypto trading sideways under a level of resistance.
Litecoin [LTC]

Source: LTC/USD on TradingView
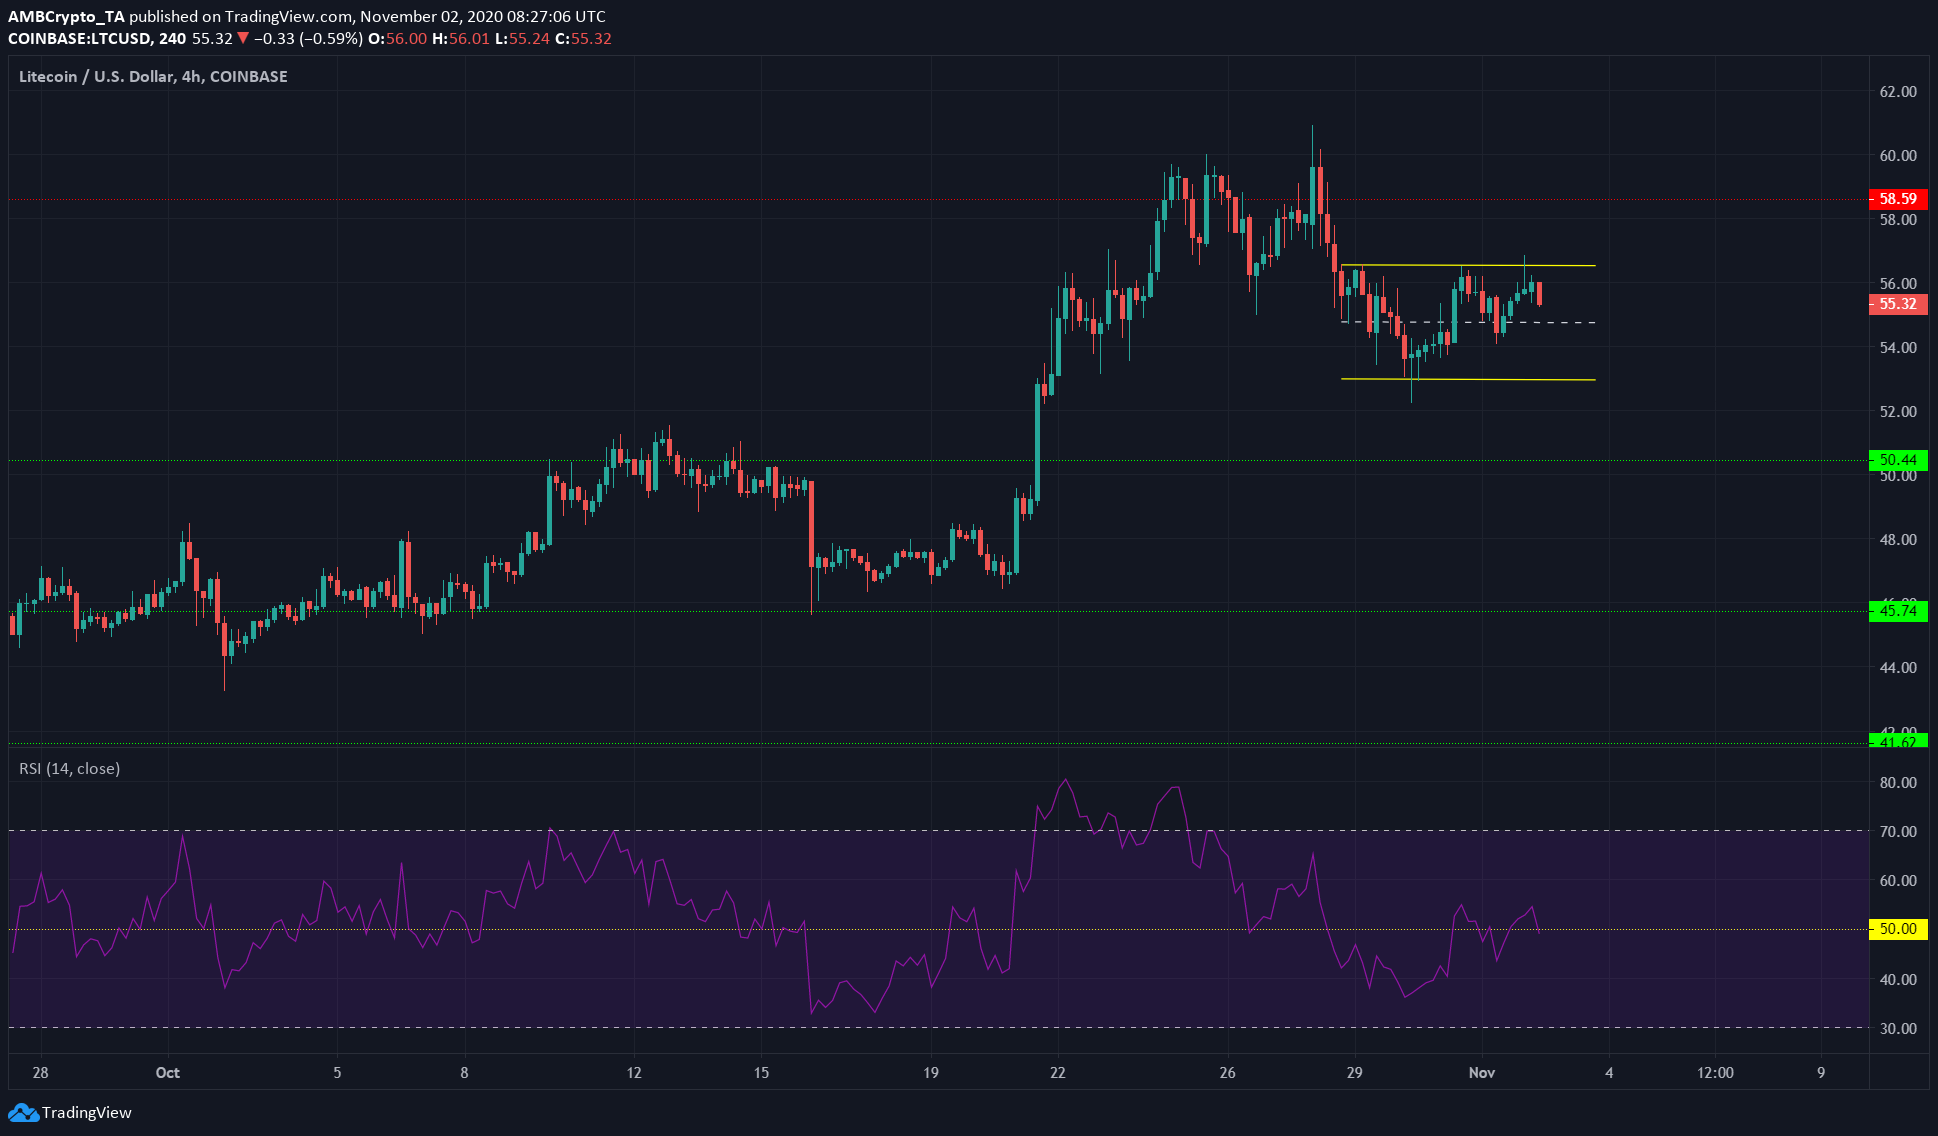
Litecoin surged to $60 but was rejected in succeeding trading sessions while being unable to hold on to the level at $58. Over the past few days, the price sunk lower and LTC was trading within a range of $56.5 to $53.
This rectangle (yellow) could see a breakout to either direction in the coming days. A close outside the pattern accompanied by significant trading volume would confirm a breakout.
The RSI was oscillating around the neutral zone over the past few days, pointing to a lack of notable momentum for the crypto-asset in either direction.
Litecoin was forming a symmetrical triangle over a longer timeframe and could see a bullish breakout. In the short-term, however, sideways movement could be the way for the asset.
Polkadot [DOT]

Source: DOT/USDT on TradingView
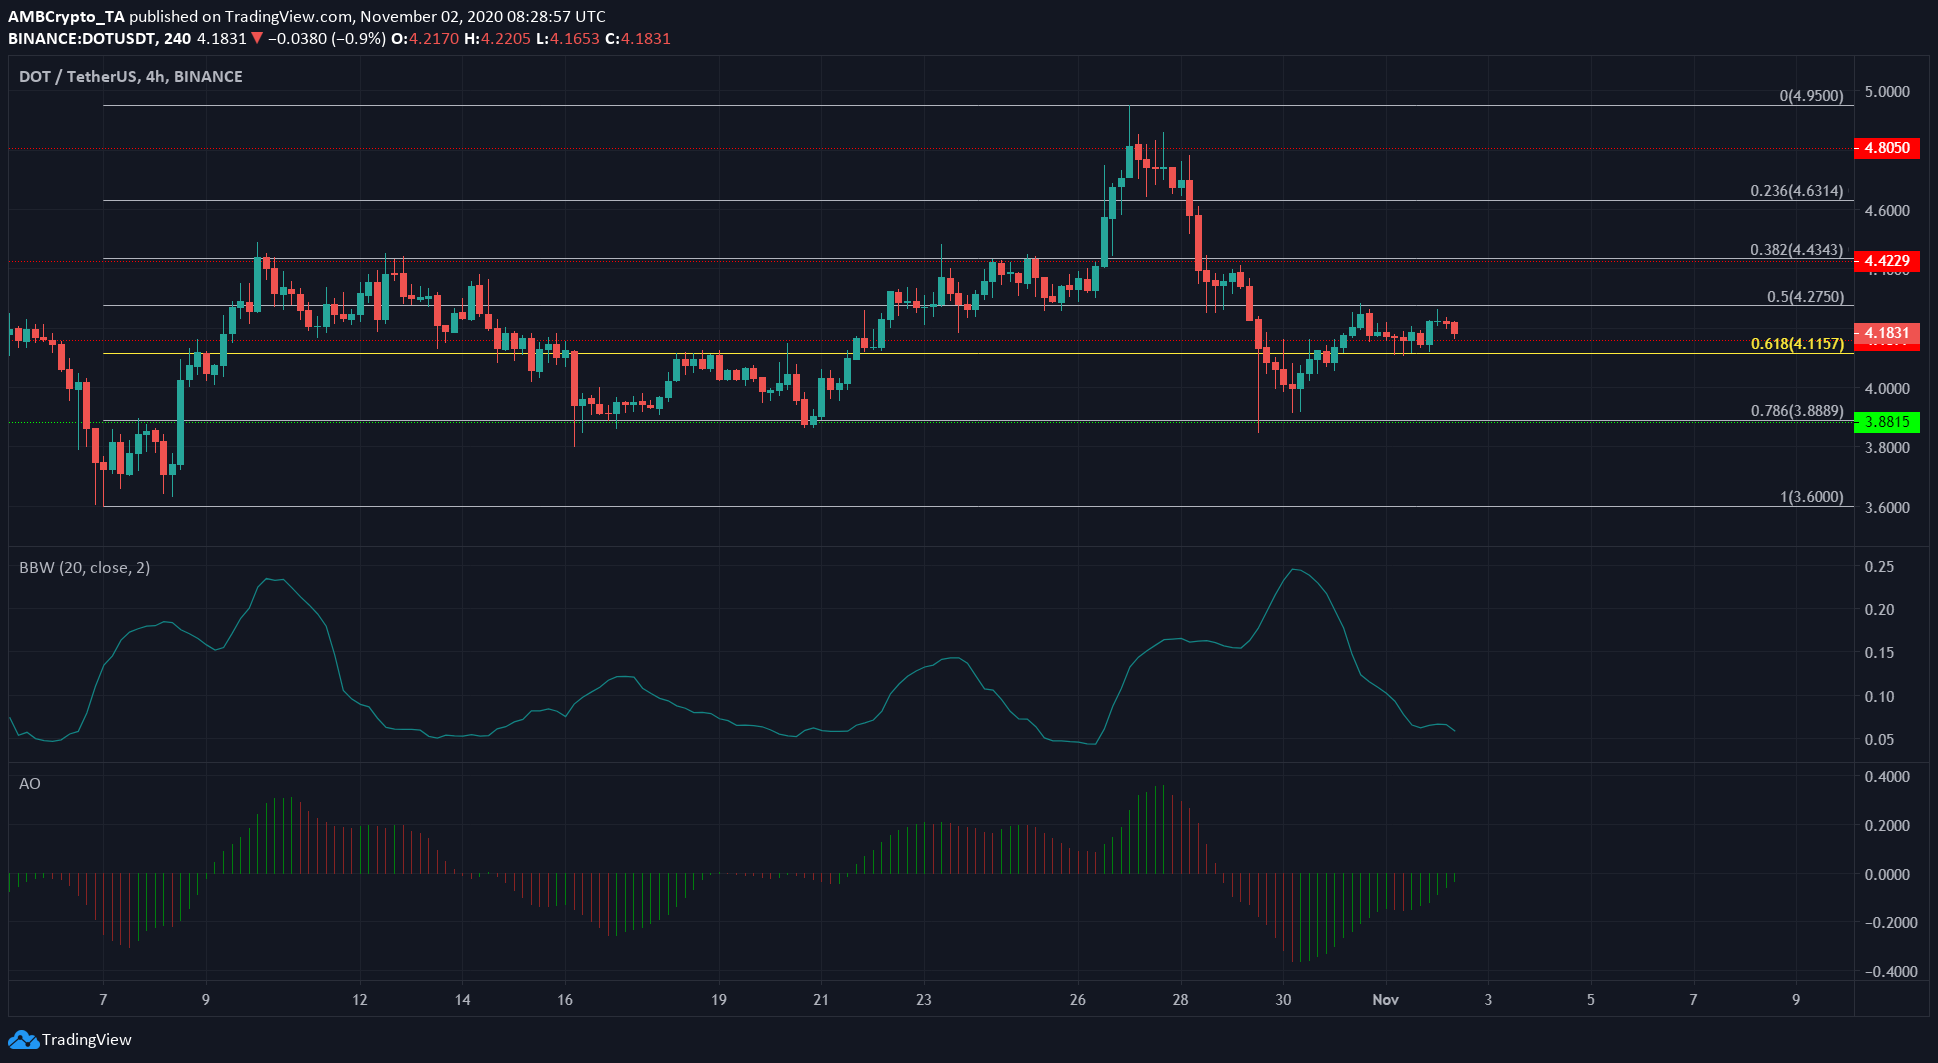
Polkadot was trading just above the 61.8% retracement level, as highlighted by the Fibonacci Retracement tool on DOT’s move upwards from $3.6 to $4.95.
DOT dipped to as low as $3.9 where a level of support lay and bounced upwards to reclaim the $4.18-level.
The Bollinger Bands‘ width was receding on the charts, a sign of volatility decreasing too. The Awesome Oscillator also saw bearish momentum wane.
In conclusion, a period of consolidation was likely in store for DOT between the price range of $4.11 and $4.27 over the coming days.
FTX Token [FTT]

Source: FTT/USD on TradingView
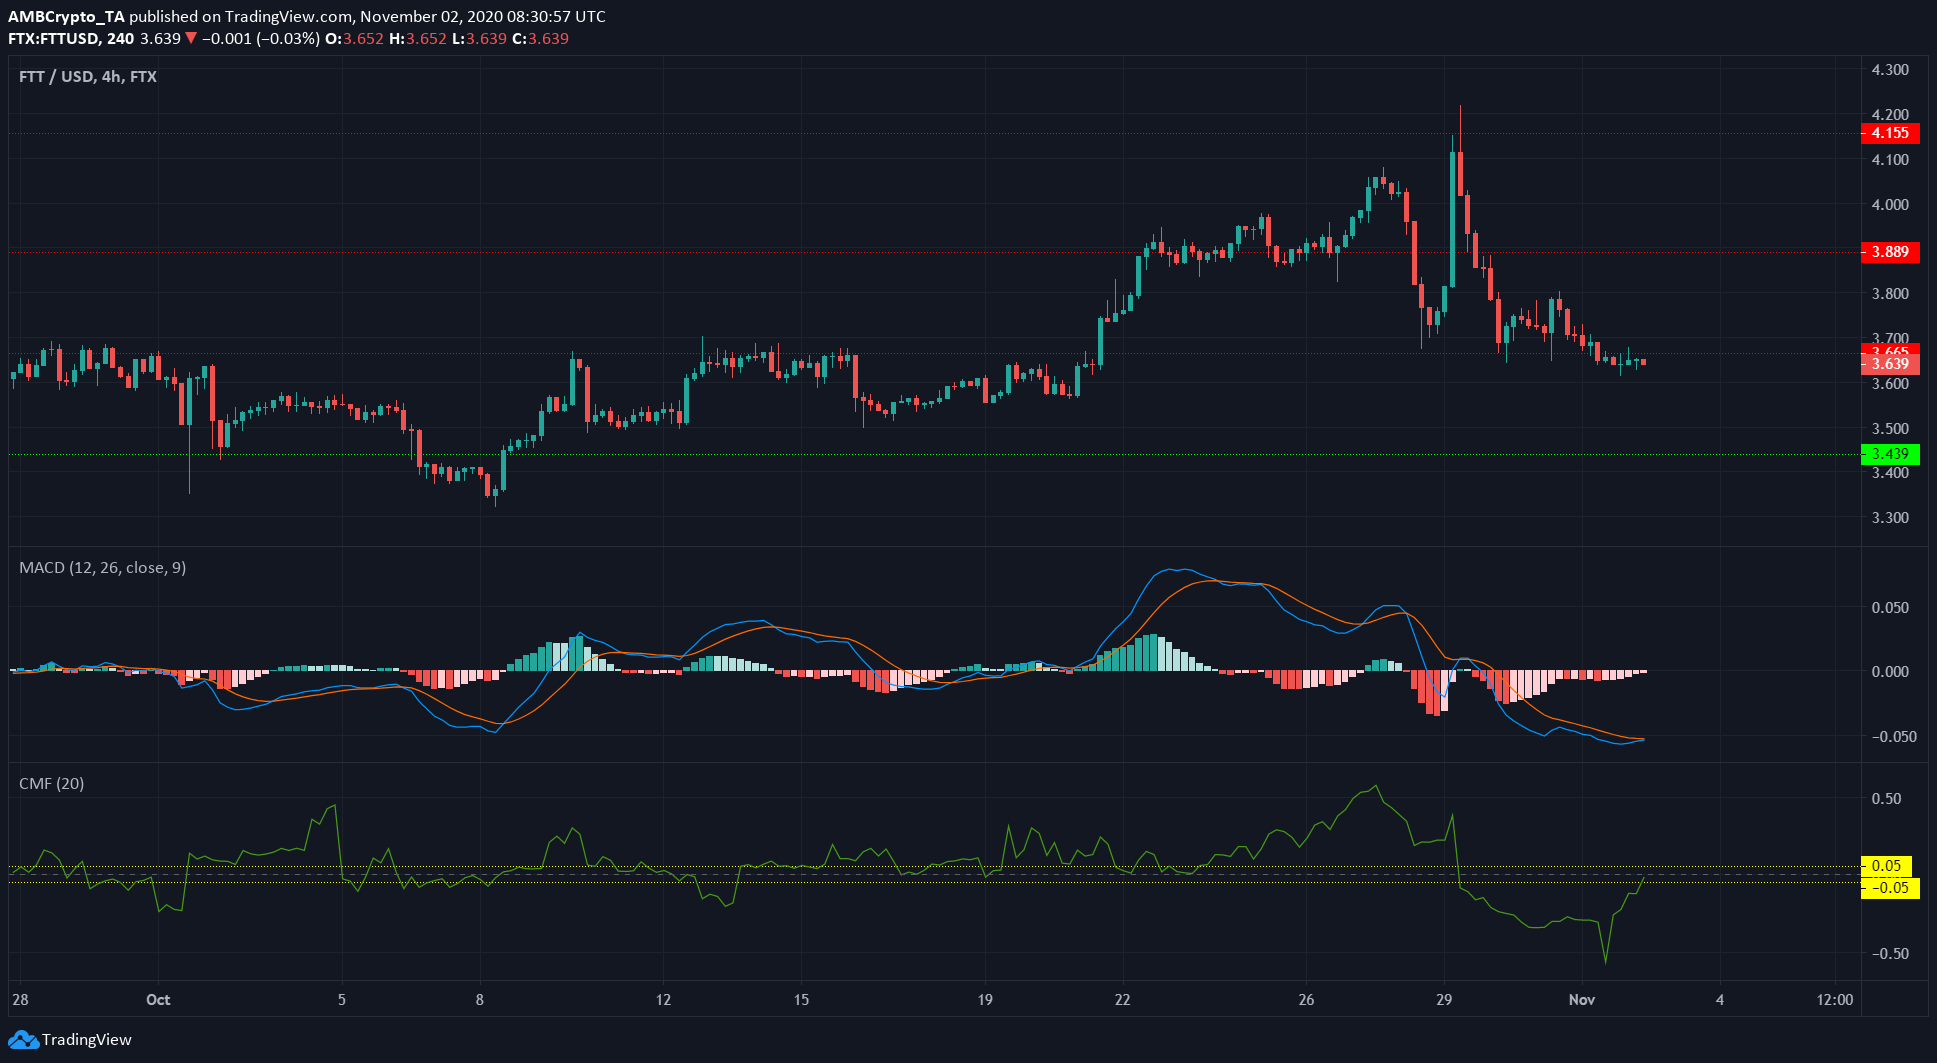
FTX Token saw significant volatility over the past week, but appeared to have settled down for a quiet few hours just underneath the resistance at $3.66.
The MACD was on the verge of forming a bullish crossover. This would give a weak buy signal as it was forming below zero. The momentum shift might see FTT move north, well above the imminent level of resistance.
Further, the CMF also showed that capital flows were reaching an equilibrium after the past few days saw capital flowing out of the market. Taken together, they pointed to an end to selling pressure in the near-term.
In related news, FTX exchange recently announced that tokenized equities would soon be listed.

![Reasons why Litecoin [LTC] investors should be concerned](https://engamb.b-cdn.net/wp-content/uploads/2023/12/ambcrypto_A_Litecoin-themed_scen-400x240.png.webp)


