Litecoin could break above pennant boundary to early-Dec values

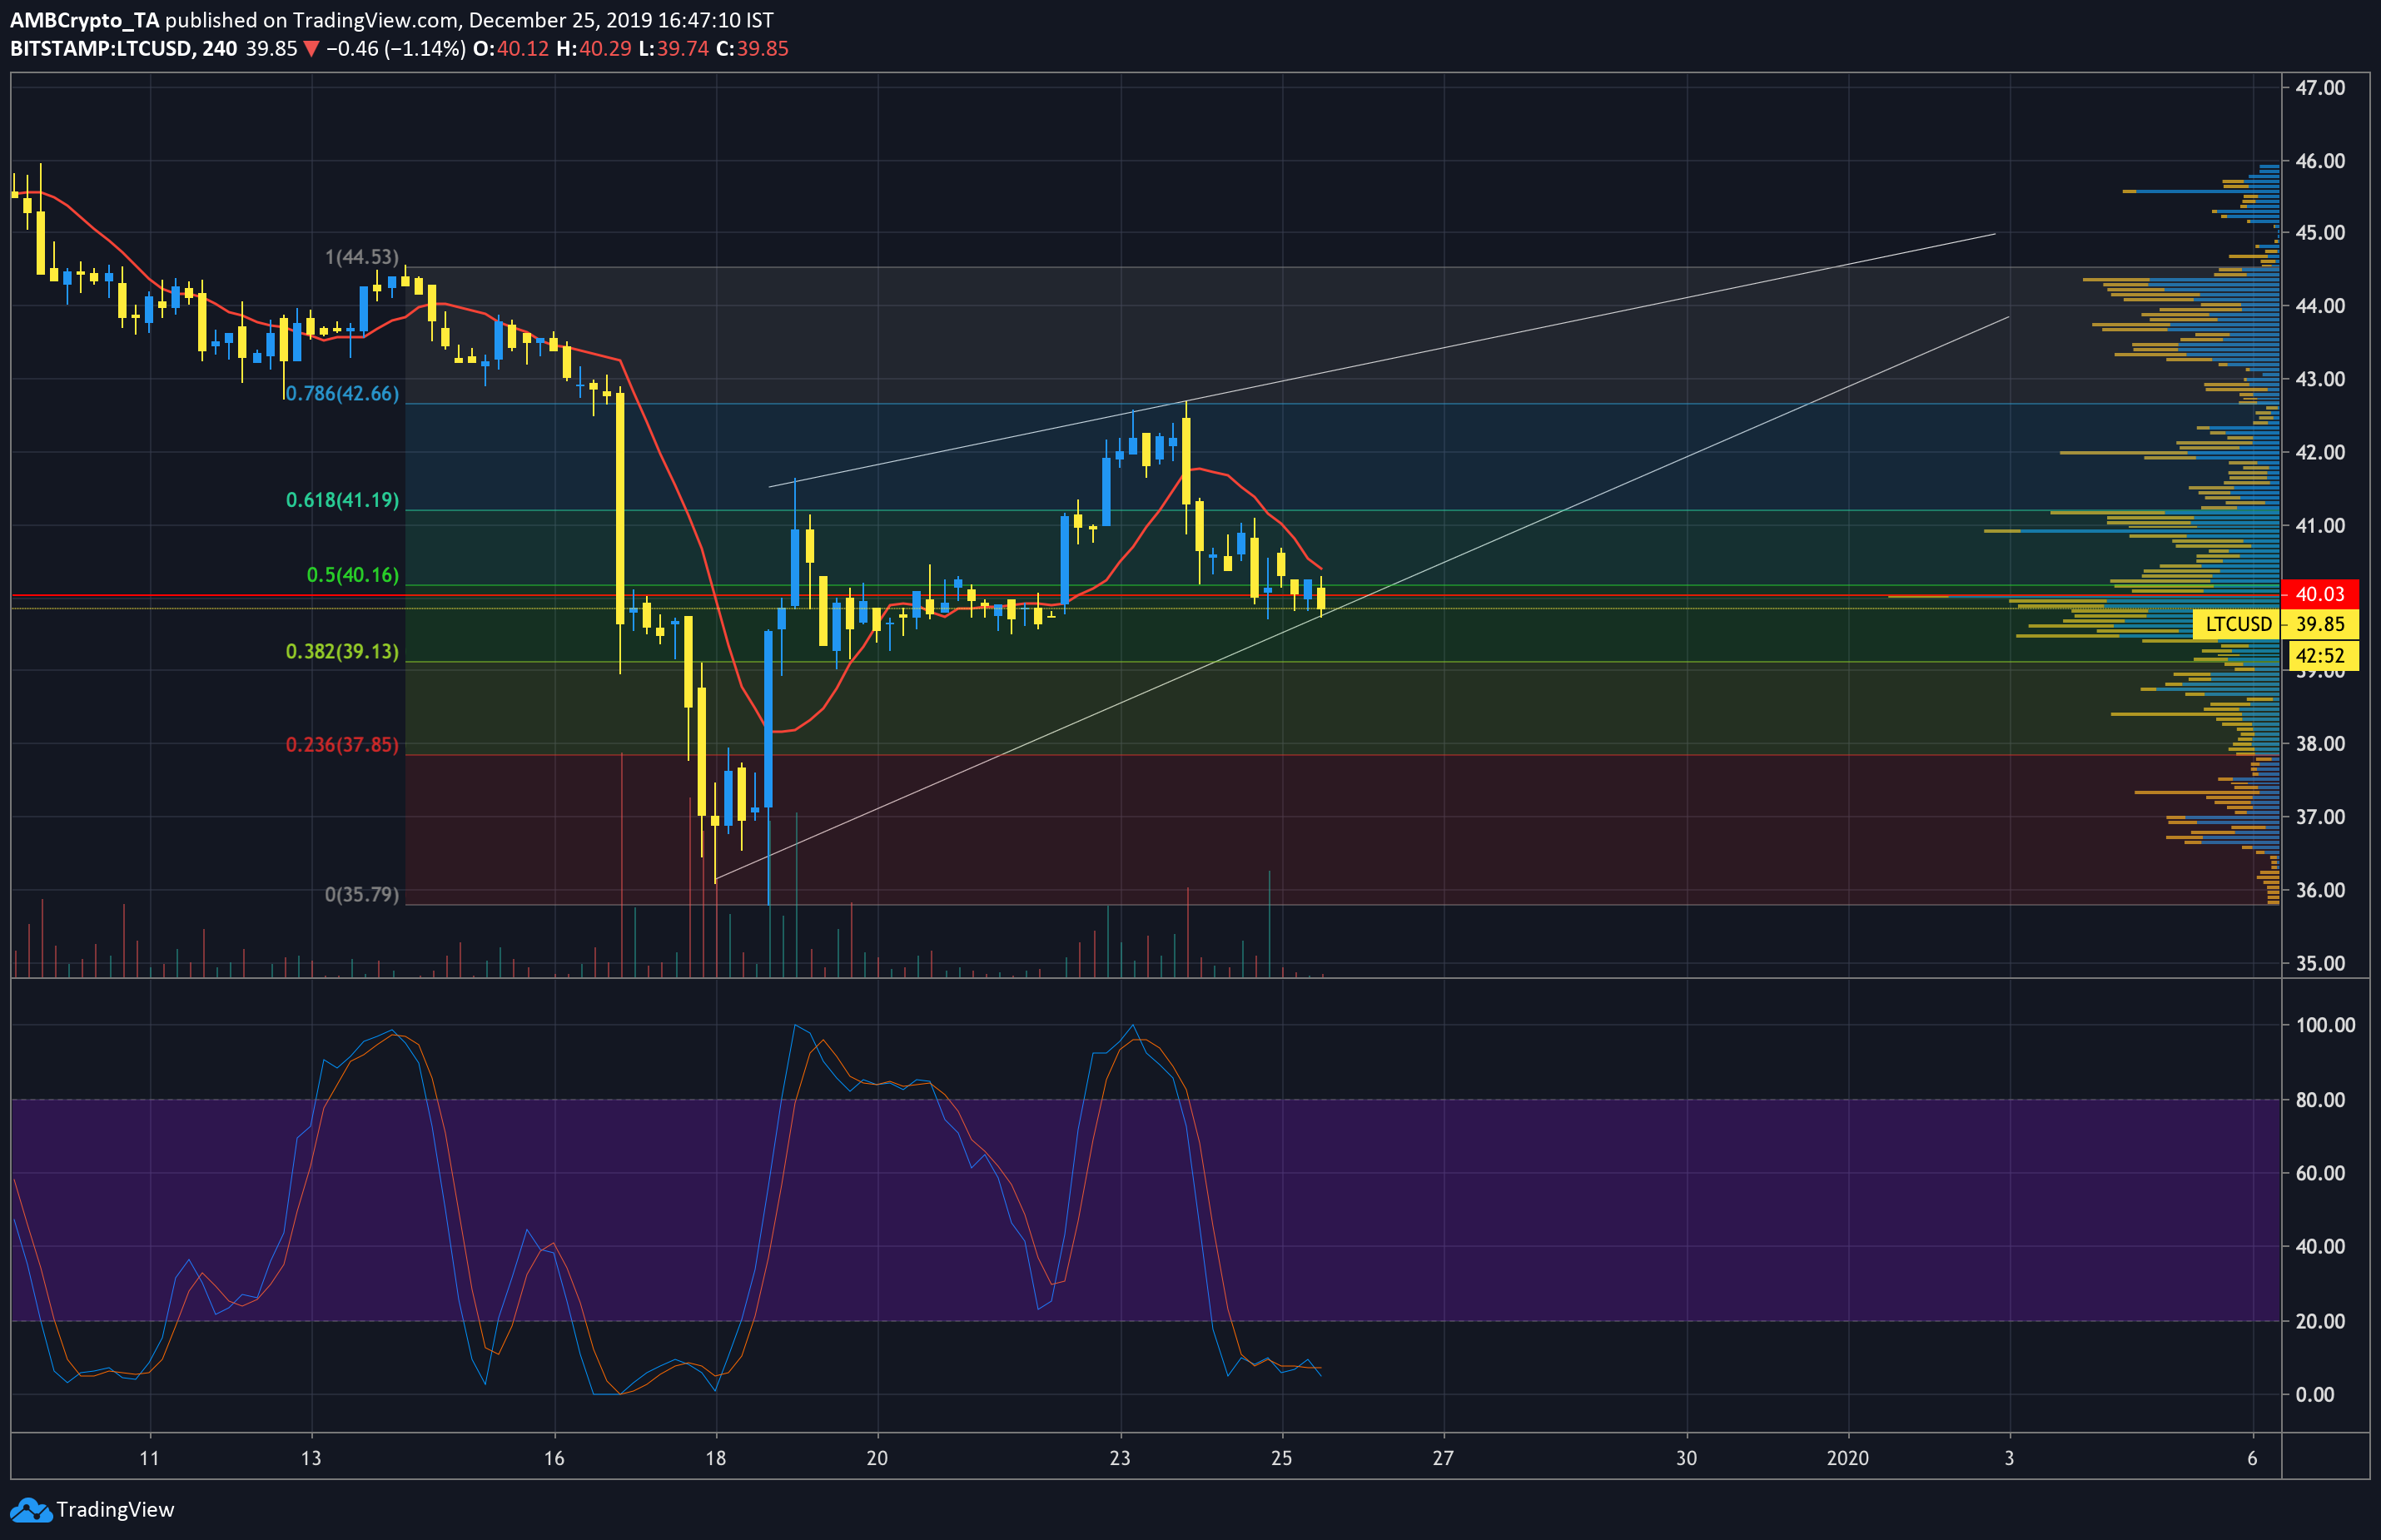
Despite Litecoin dropping by 16% in a little over a day on December 16, it has made considerable headway in crossing above the $40 mark, valued at nearly $43 just two days ago. At the time of writing, LTC’s $40 price-tag is still better than the December low at $35, which was last seen in February 2019.
Litecoin 4-hour chart

Source: LTCUSD on TradingView
The drop that occurred earlier in the month sparked LTC into a pennant formation, and a decreasing volume trend over the period since. These patterns tend to exhibit upward-facing breakouts slightly more often than not, though it’s more of a coin flip than a game of dice.
With LTC price currently around the point of control on the volume profile, the decreasing trade volume could indicate a move up in value to the next high-volume node, around the 61.8% Fibonacci retracement line. Furthermore, the 9-day moving average looked to be dipping down, with a rise in volumes additionally enabling the price to cross above the MA line.
The Stochastic RSI indicator reported an oversold market, with the indicator lines just under the 7.00 mark. Its sideways movement could be an indicator of relative market stability in the short-term, before a slow rise in value in the days to come.
Litecoin Realized Cap and Market Cap

Source: CoinMetrics
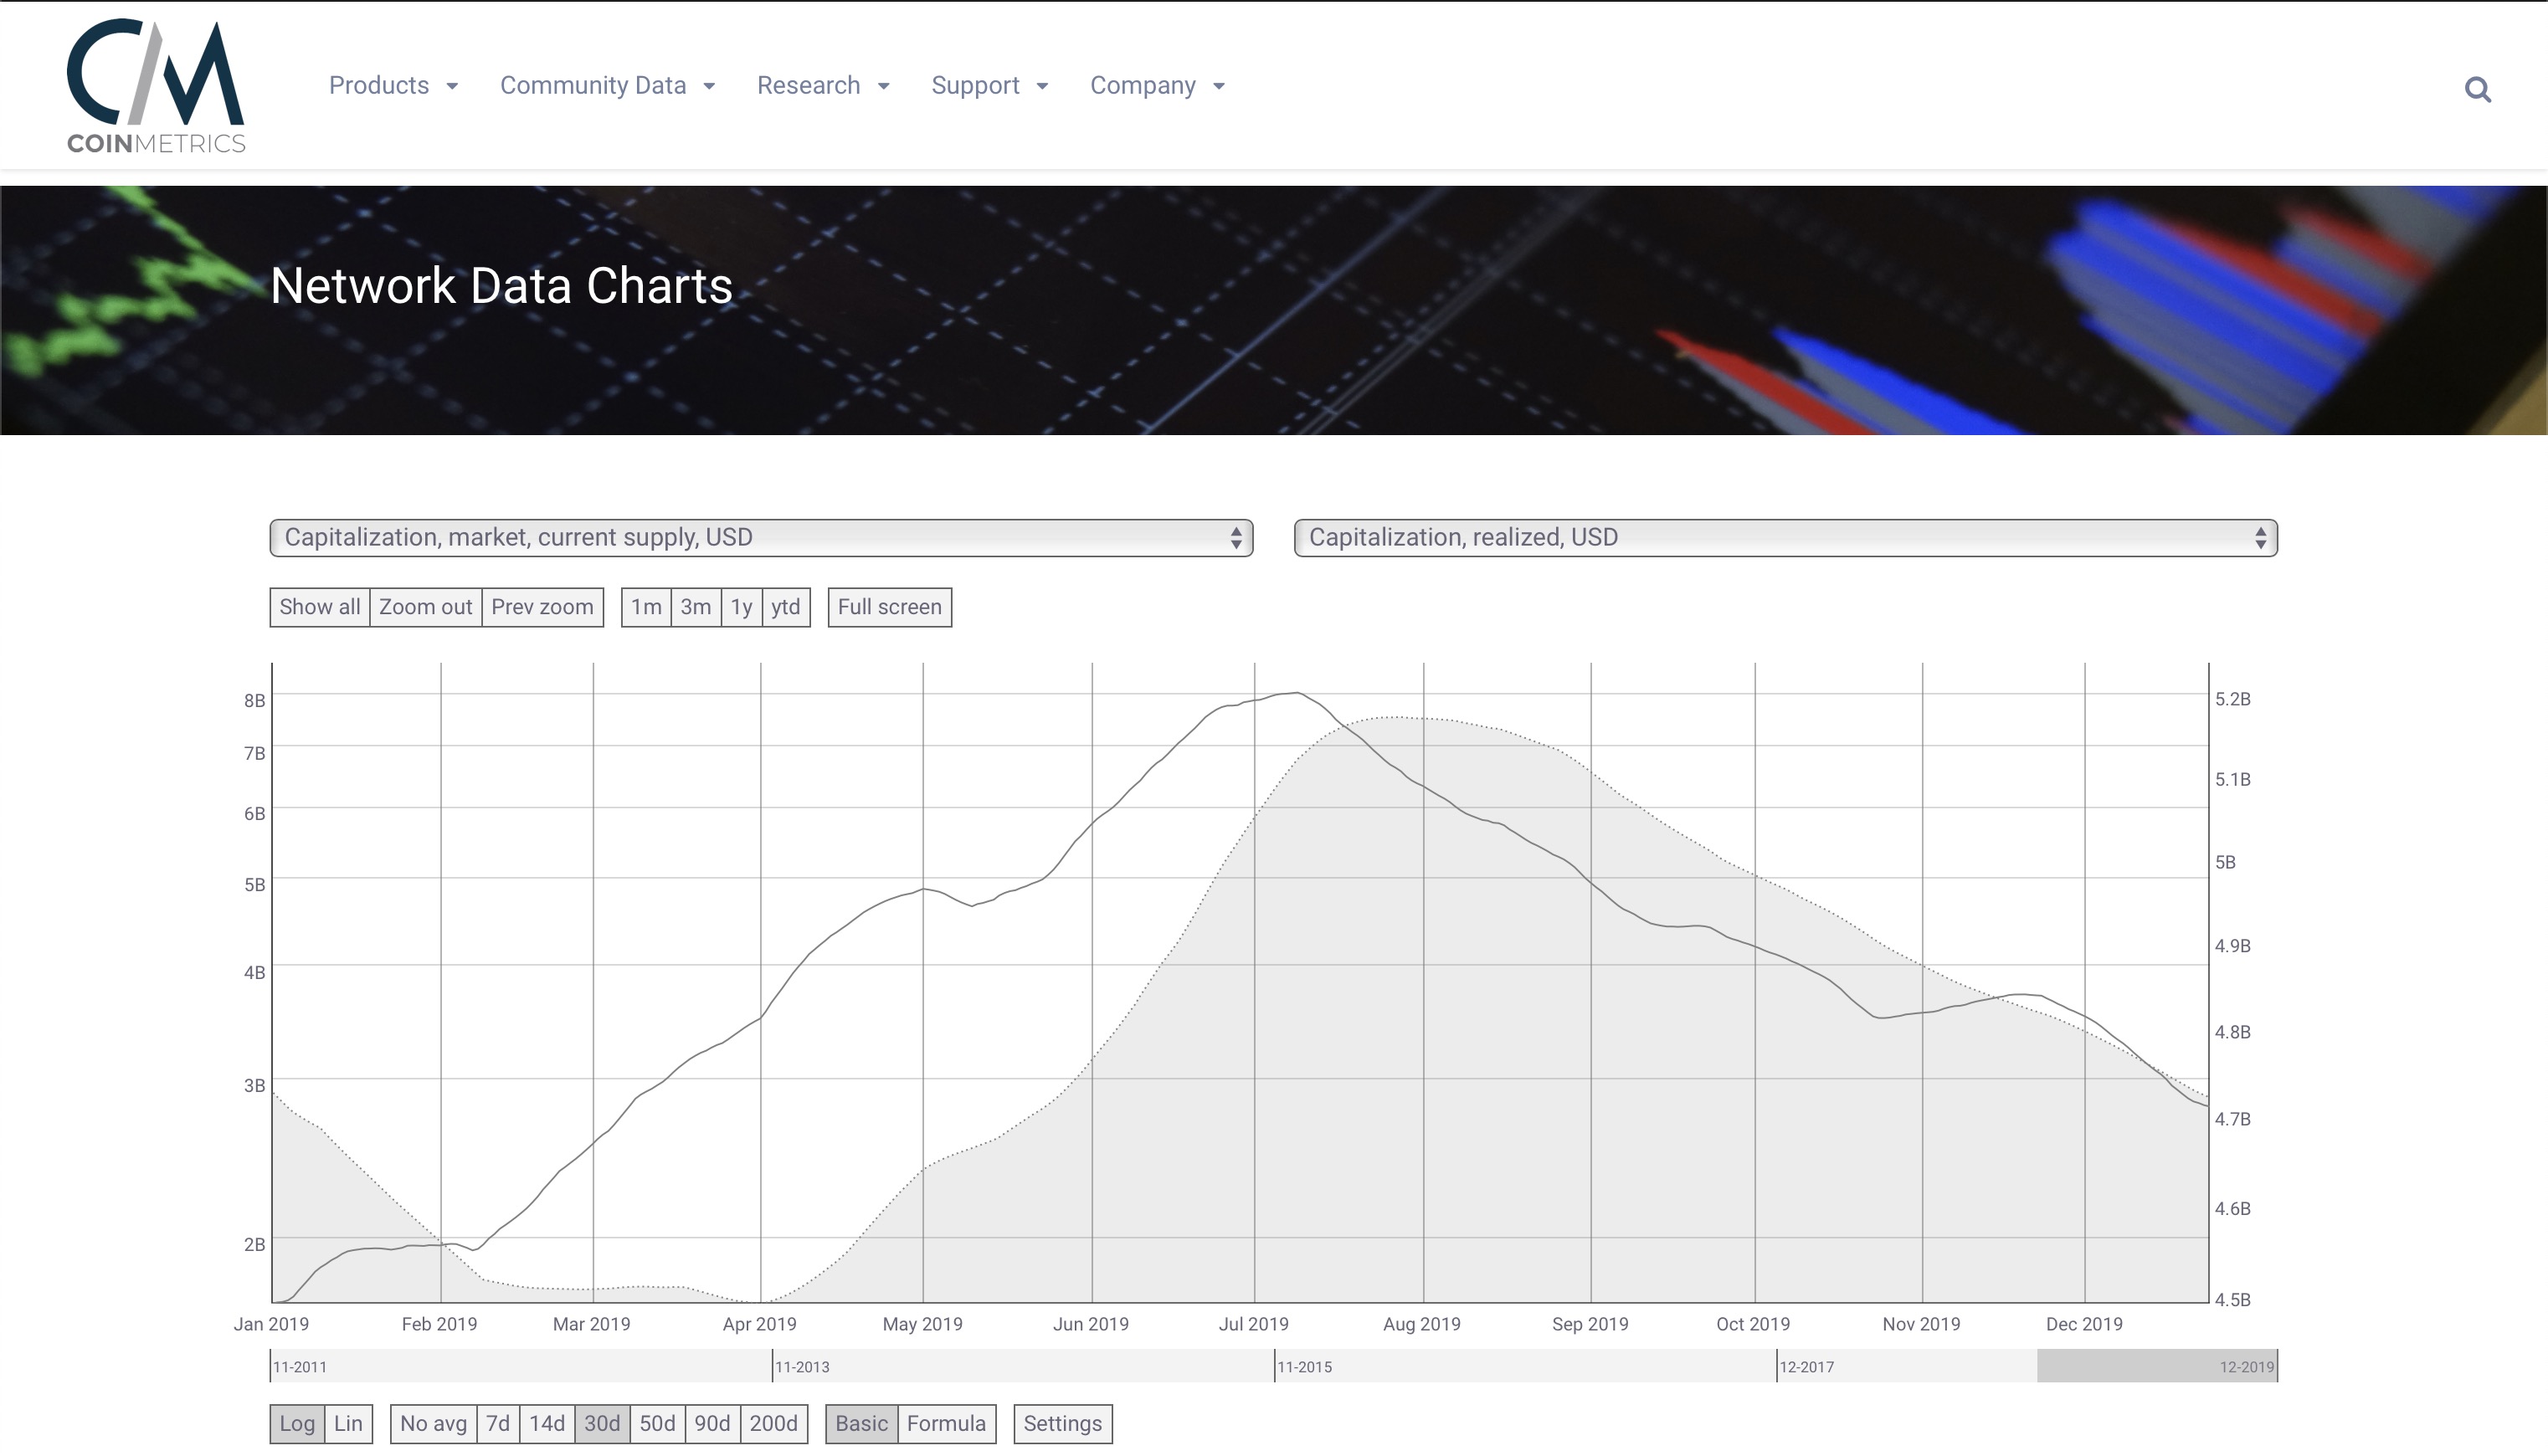
CoinMetrics data shows the Litecoin 30-day realized cap is currently higher than its market capitalization, after being under the market cap since mid-November.
Conclusion
It seems unlikely that a sudden move in either direction will occur, and far more likely that Litecoin will steadily move up. A breakout could be predicted to occur in the next two to three days, moving LTC up to $45, just above the 100% Fibonacci retracement line.

![Reasons why Litecoin [LTC] investors should be concerned](https://engamb.b-cdn.net/wp-content/uploads/2023/12/ambcrypto_A_Litecoin-themed_scen-400x240.png.webp)


