Analysis

Litecoin can’t bear the descending triangle; hopes to sustain itself within channel
Posted:

Litecoin, hours after breaking into its infamous Death Cross, has doubled down on its bearish claims. The fifth largest cryptocurrency in the world was going though a slump, well before its August halving. Trading at below $65 at press time, the coin’s lowest price point since the beginning of April, Litecoin’s tag as one of the biggest gainers in 2019 has been wiped clean.
Often referred to as the digital silver owing to it playing second fiddle to Bitcoin, Litecoin’s halving was an event every crypto-hothead marked in their respective calendars. However, it didn’t amount to much. The halving of the block reward from 25 LTC per block to 12.5 LTC did see the price reach $144. However, the same was almost a month and a half before the actual event. Since then, the anticipation has turned to a bearish dread, leading to a price shave.
SHORT TERM
Source: Trading View
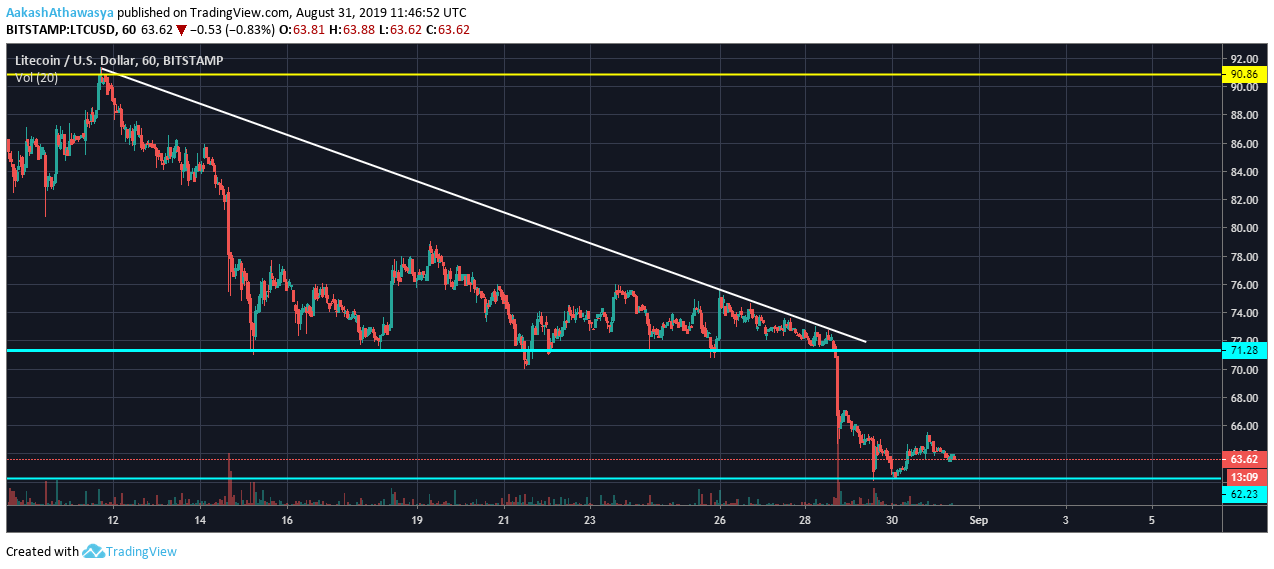
Looking at the short term hourly chart, the price of Litecoin has fallen out of a descending triangle. The base of the triangle is marked by the support line placed at $71.28, which the crypto dropped below on August 29. The aforementioned drop was highlighted by a massive 8.5 percent drop in 4 hours, as the price fell from $72.02 to $65.92. The crux of that drop occurred at 1700 UTC as LTC lost 5.78 percent of its value.
Now that the coin is trading below this level, the next level that will be looked at with concern is $62.2, a mark the coin is just over at press time. Litecoin bottomed out of the support level at midnight on 30 August as the price pushed above. Currently, with volume on the down low and the Relative Strength Index pointing to a mild resurgence out of the ‘oversold’ zone below 30, a move out of the channel below the base of the triangle looks unlikely. If Litecoin does jump above, $71.28 will act as a major support level for the coin.
ZOOMING OUT
Source: Trading View
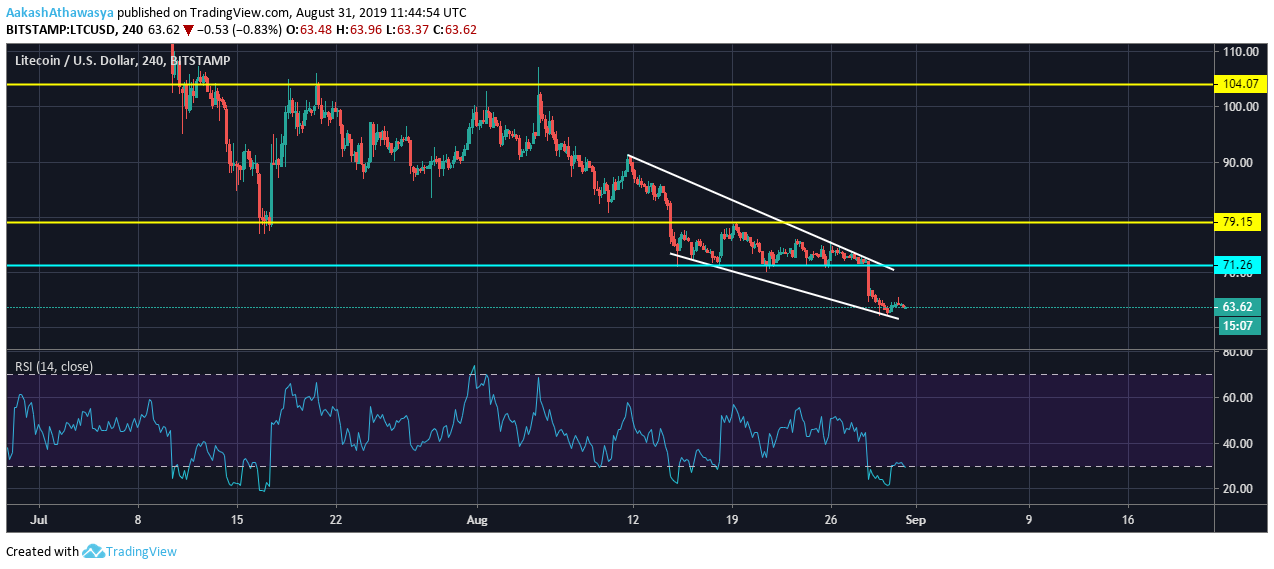
Litecoin’s 4-hour chart shows the coin trading in a descending parallel channel. LTC has seen continuously slumping highs placed at $90.98, $85.75, $78.51, and $72.48, respectively. The triangle base as seen on the hourly chart finds a place on the 240 chart as well, cutting the red candlesticks that represent the 28 August LTC sell-off. Other important resistance levels for the cryptocurrency which look highly unlikely to be tested are placed at $79.15, and $104.07.
Based on the perspective of the two charts, coupled with the fact that Litecoin broke into its Death Cross recently, a bearish sustenance looks highly likely. As mentioned earlier, the RSI is still flirting with the oversold zone, while the MACD is still in a tussle with the Signal line. The level of $62.23 will act as a major support for Litecoin, while the overhead resistance of $71.28 is unlikely to be broken for a while, especially given the teetering volume.
![Reasons why Litecoin [LTC] investors should be concerned](https://engamb.b-cdn.net/wp-content/uploads/2023/12/ambcrypto_A_Litecoin-themed_scen-400x240.png.webp)