In the prequel to this article we tried building a simple Bitcoin buying strategy, and in this post, we attempt to scale it further. But before that, let’s recap.
Our strategy entailed only buying Bitcoin based on one trigger, the 200-day moving average (DMA). If the daily trading price crossed over the 200 DMA, we’d buy Bitcoin, and if the price crossed below the 200 DMA, we’d buy USDT with the objective of buying Bitcoin. This way we either buy Bitcoin, or buy USDT to buy Bitcoin, and since we’re using the daily moving average, we’re buying Bitcoin daily, hence dollar-cost-averaging in the process.
Again, a reminder, we’re using the USDT to buy Bitcoin the day after the daily trading price crosses above the 200DMA. Since the trading price and the 200DMA, have had 3 crossovers since 2020 began we have a decent sample size to try our strategy.
In the previous post, we looked at one dollar of Bitcoin (or USDT, depending on the 200DMA) a day every day for the first nine months of the year. This equates to 274 buy-only transactions. In this post, we’ll scale the same to $5 and $10 respectively, to see how much we’d end up making, and how it would compare to the price at the end of the trading period i.e. 30 September and the price now.
$5 Money kept aside
From this second ‘money kept aside’ iteration, let’s scale it to look at $5 invested in either Bitcoin or USDT in a buy-only daily strategy. Once again, we’ll look at how much USDT was invested and how much Bitcoin was bought, not in dollar terms, but in actual BTC amounts, fractions, or whole.
Broadly speaking, these would be our results,
| $5 bought category | Amount | Average price |
| Bitcoin bought when price > 200DMA | ₿ 0.095836 | $ 9,996.32 |
| USDT bought when price < 200DMA | $420 | $ 7,317.05 |
| First USDT buy amount | $135 | $ 9,146.08 |
| First USDT buy amount in BTC | ₿ 0.014760 | $ 9,146.08 |
| Second USDT buy amount | $25 | $ 8,452.30 |
| Second USDT buy amount in BTC | ₿ 0.002958 | $ 8,452.30 |
| Third USDT buy amount | $260 | $ 8,302.63 |
| Third USDT buy amount in BTC | ₿ 0.031315 | $ 8,302.63 |
| Total BTC via USDT | ₿ 0.049034 | $ 8,633.67 |
| Total BTC bought | ₿ 0.144870 | $ 9,315.00 |
Table 1.0:$5 strategy – Bitcoin and USDT with an average price
At first, this table seems confusing, but let me explain. The first two rows are how much Bitcoin and USDT you’d buy respectively, based on the days the 200DMA trails under and over the daily trading price. This means that if you’d bought $5 worth of Bitcoin every day between 1 January and 30 September, when its daily price was over the 200 DMA, and bought $5 of USDT when Bitcoin’s price was below the 200 DMA, you’d have,
- BTC 0.095836, and
- USDT 420
Here’s the fun part. The immediate day after the price crossed above the 200 DMA, you’d use the accumulated USD to buy Bitcoin. So, on three occasions, namely 27 January, 3 March, and 29 April, when the trading price jumped over the 200DMA, you’d buy Bitcoin using USDT in the following denominations, $135, $25, and $260 respectively, amounting to your total of $420. Using this USDT pool, you’d buy a total of BTC 0.049, at an average purchase price of $8,863. How much Bitcoin does that leave you within?
A total of BTC 0.144, at an average purchase price of $9,315, similar to the $1 buying strategy, but one that is scaled higher because of your increased investment from $1 a day to $5 a day. This strategy takes your profit to 15 percent against the trading price of Bitcoin at the end of the period i.e. 30 September and 39 percent higher than the current price over $13,000. Now, let’s look at the third and final leg of this strategy.
$10 A conscious move
At first, this may be just an x2 move of the previous $5 buy, but it bears introspection because the more you look at this kind of purchase the more your profit rises. We’ll see how once we get through the table.
Broadly speaking here are your results from the same strategy scaling the Bitcoin buys from $5 to $10.
| $10 bought category | Amount | Average price |
| Bitcoin bought when price > 200DMA | ₿ 0.191673 | $ 9,996.32 |
| USDT bought when price < 200DMA | $840 | $ 7,317.05 |
| First USDT buy amount | $270 | $ 9,146.08 |
| First USDT buy amount in BTC | ₿ 0.029521 | $ 9,146.08 |
| Second USDT buy amount | $50 | $ 8,452.30 |
| Second USDT buy amount in BTC | ₿ 0.005916 | $ 8,452.30 |
| Third USDT buy amount | $520 | $ 8,302.63 |
| Third USDT buy amount in BTC | ₿ 0.062631 | $ 8,302.63 |
| Total BTC via USDT | ₿ 0.098067 | $ 8,633.67 |
| Total BTC bought | ₿ 0.289740 | $ 9,315.00 |
Table 2.0:$10 strategy – Bitcoin and USDT with an average price
Once again, the average price remains the same across the board, and the amount bought only doubles. At the end of the period, you’d have
- BTC 0.1916, and
- USDT 840
Similar to the previous set-up, you’d use your accumulated USDT 840 thrice to buy Bitcoin. Here’s where the ‘averaging’ in ‘dollar cost averaging’ comes into play, and you might’ve caught in the previous post as well. Notice, that the first direct Bitcoin has put your average at just short of $10,000, a pretty high amount, and when the price is dropping you’re buying USDT and not Bitcoin, even though the cryptocurrency is trading at a lower price. But each time you end up using your USDT to buy Bitcoin, you’re doing so with a surety, what’s the surety? The surety is that the current price is strong as it has risen over its 200DMA, and there is enough momentum to take it higher. This is the bet you’re riding on.
With this bet, each time you’d end up buying Bitcoin for USDT (and not directly for fiat), you’re bringing down your average. That is why the majority of Bitcoin direct buys when the price was over the 200DMA was made at an average price of $9,999, and by the end, you’d end up pulling down your average to $9,315.
This strategy gives you a few safety measures, as listed below
- Buying only when the price has some momentum (indicated by the 200DMA)
- Hoarding USDT when there is no momentum or falling momentum
- Using the USDT to immediately buy BTC when momentum has established
- Relying on just one long-term indicator (the 200DMA) and not ‘overengineer’ your strategy
- Not selling, and keep hodling
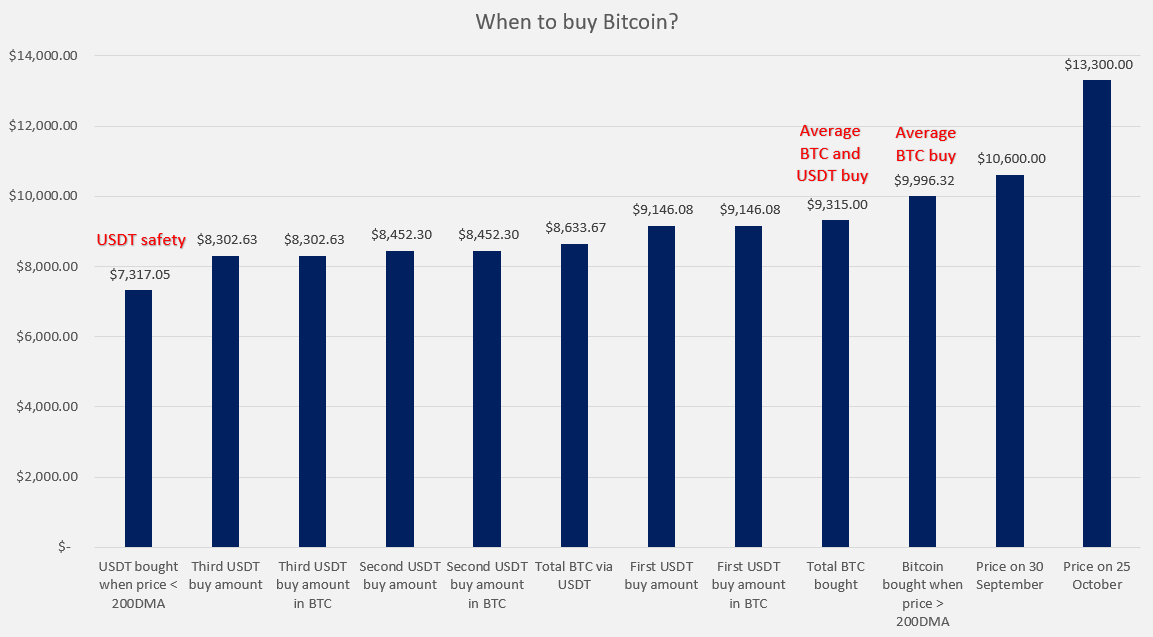
Here’s how the price looks against the USDT safety, the average BTC buying price, the average USDT and BTC buying price, and against the daily trading price as of September 30 and October 25. A healthy profit and some safety.
Does simplicity work?
So, a simple buy-only strategy does reap a healthy profit of over 15 percent while still hodling on to your bags. Now it’s no yield farming 300x return, nor is it a leverages position via derivatives where the liquidation risk is high. However, it does provide a good bit of profit without too much of a headache on the buying front, and the holding front, and relying on just one simple long-term indicator. Simple is no perfect, but it’s pretty darn close.