Ethereum noted a fall of 9.40% in the month of September, pulling the value of the coin from $204.80 to $185.54. However, October provided some relief after the price noted a rise of 9.82%, taking the price from $172.16 to $189.14. The second largest coin in the cryptocurrency market currently stands priced at $184.82, with a market cap of $19.98 billion.
However, the long-term chart has predicted that the rise could only be momentary and that the coin might note a fall.
Daily ETH chart
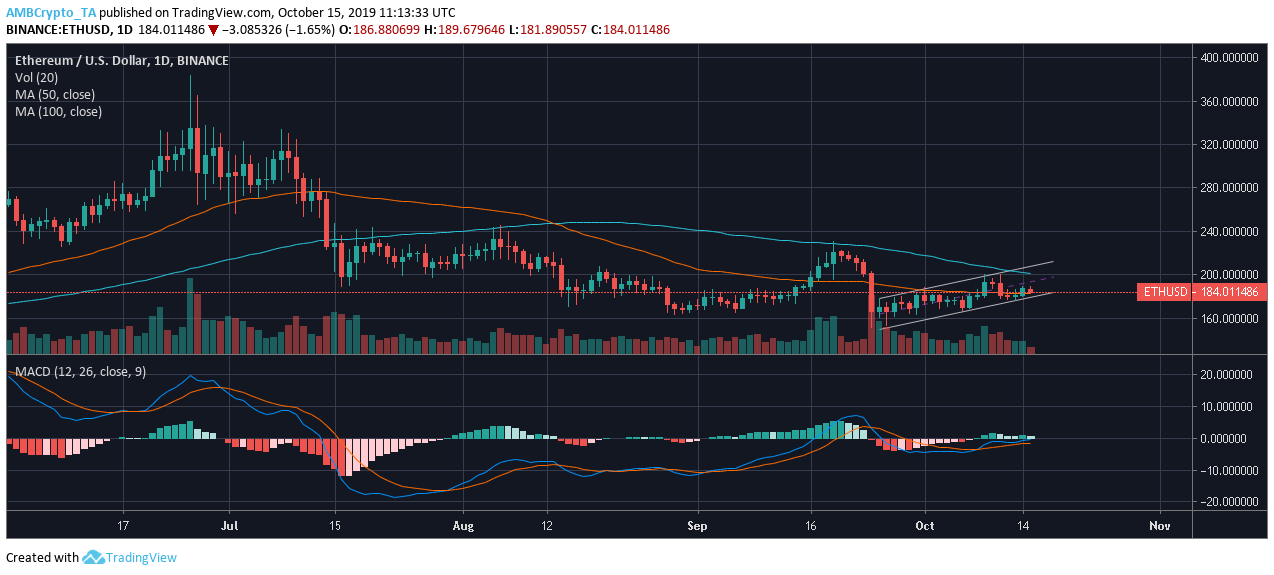
Source: ETH/USD on TradingView
The daily chart for Ethereum suggested the formation of an ascending channel. This channel, characterized by two upward sloping lines, marked the higher highs at $177.12, $183.85, and $200.98 and higher lows at $152.04, $168.56, and $176.51. According to the nature of the formed pattern, a breakout towards the downside may take place with its breach.
The moving average 50 lay under the moving average 100 for the 62nd consecutive day. The averages rested above the candlesticks, indicating a highly bearish market. Even though the MACD indicator suggests a bullish market, the reduced momentum implies that a reversal of trend could be possible.
Conclusion
The long-term chart for Ethereum points at a devaluation in the value of the coin, as it breaches out of the ascending channel.