
Ethereum has been one of the worst affected coins following Bitcoin’s massive crash over 12-13th March. In fact, the altcoin briefly touched its December 2018 lows after trading at a 2020-high of $280 in January.
The falling wedge pattern took shape from late-August 2019 to December 2019. This bullish pattern resulted in the coin climbing to the $280-mark. Another bullish pattern was observed soon after the rally to Ethereum’s 2020 year-high price level.
The formation of a descending channel was seen from mid-February to the first week of March. This, however, did not result in a bullish break as the coin sustained a busted pattern after undergoing several market corrections along the way.
ETH Daily Chart
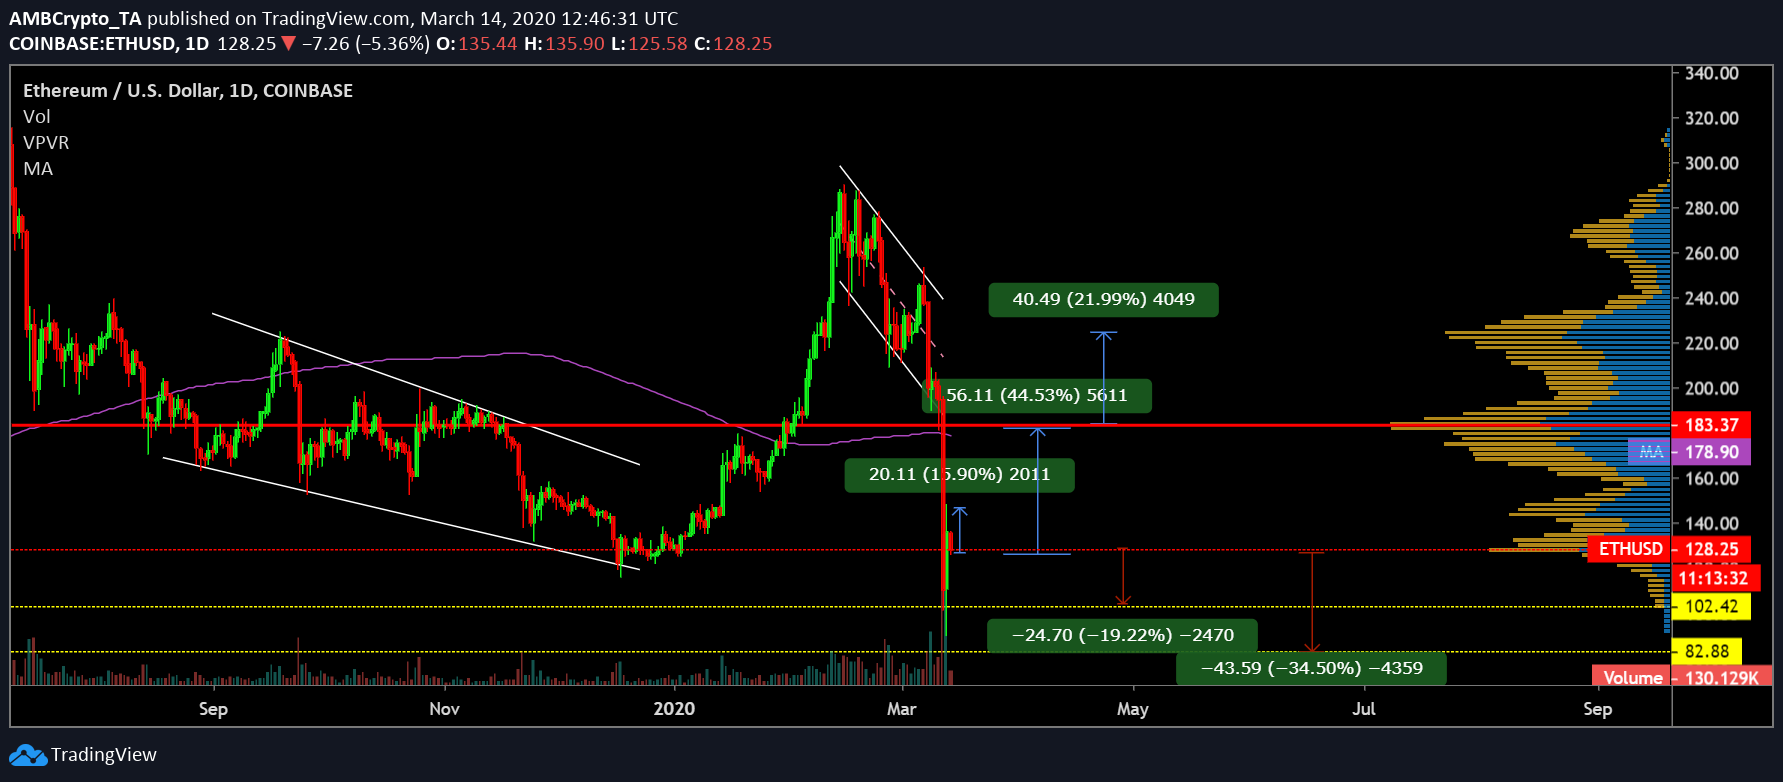
Source: ETH/USD on TradingView
Looking at the VPVR indicator, it can be observed that the trading volume was found to be close to where the coin was trading at press time, meaning that the coin could potentially consolidate within the current range at $128.
In case of a bullish break, ETH could climb higher by 15.90% to a crucial resistance point of $144. At this point, the VPVR bars have intensified, suggesting increased trading around this price range.
If the bullish trend continues and gains traction, the coin could potentially surge to another important level at $183, a point that has resisted the ETH candles on multiple occasions. Additionally, the 200-Moving Average also acted as a strong resistance point for the coin close to the aforementioned level. A further breach of this point could catapult the coin surge to $224.
However, in case of increasing bearish pressure, ETH could drop to a new low of $102, a very important support point that was last tested in February 2019. If the bearish momentum persists, the coin could trade close to $83, a price point that was last seen in December 2018.
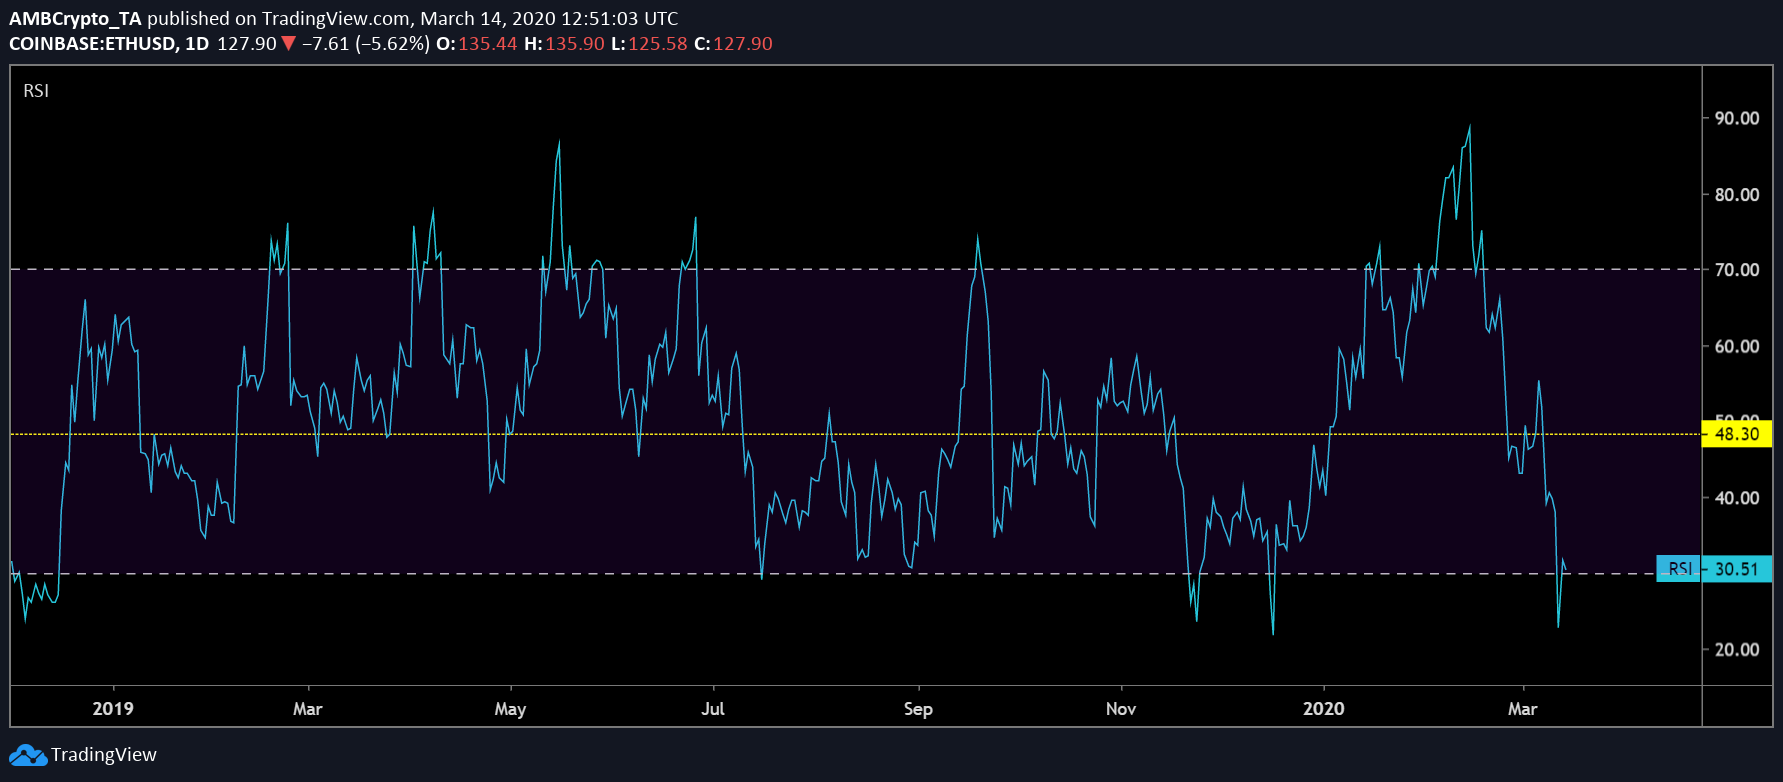
Source: ETH/USD on TradingView | RSI Indicator
The RSI Indicator indicated that ETH was in the oversold zone. Despite an upward pull towards the median, the coin bounced back near the lower band.
ETH-BTC Correlation
Ethereum has been one of the most strongly correlated crypto-assets with Bitcoin. The latest drop was propelled by the king coin’s fall on 12 March, movement which led to the breach of significant support levels. According to CoinMetrics’ chart, the ETH-BTC correlation stood at 0.84, as of 13 March.
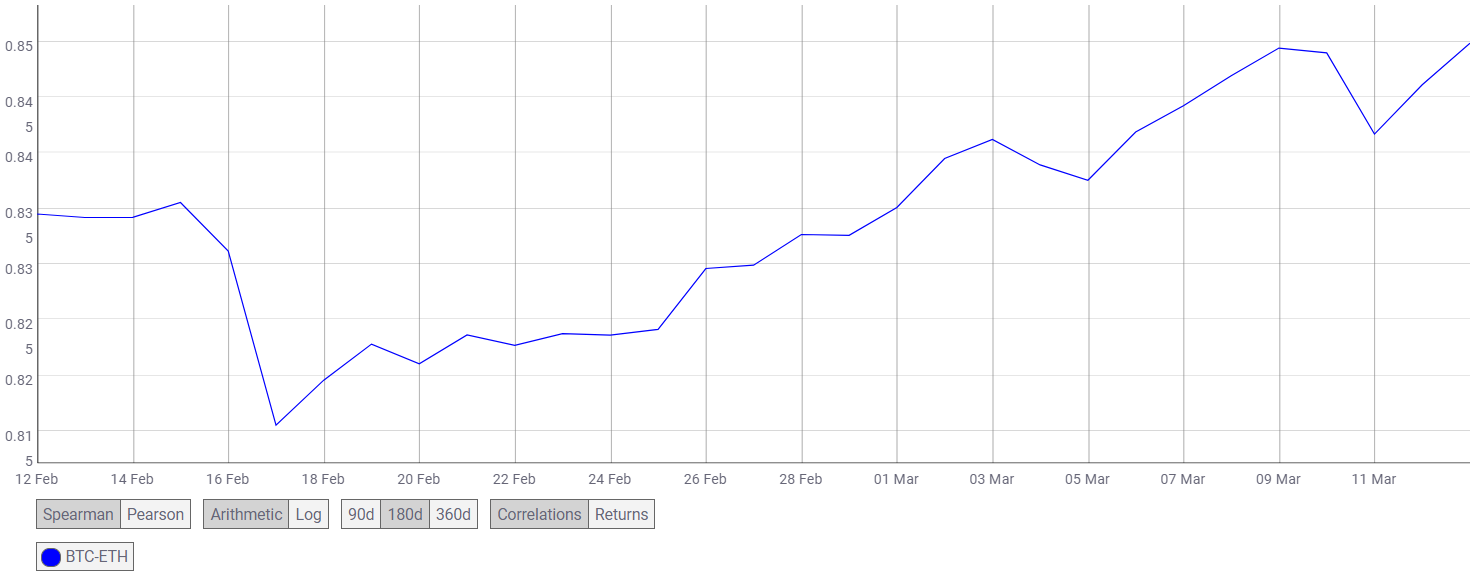
Source: CoinMetrics | BTC-ETH Correlation
Conclusion
Following strong bearish momentum, Ethereum’s price dropped significantly. As the ETH bulls struggle for revival, the long-anticipated Ethereum 2.0 could potentially be the flagging point for a surge upwards. In case of an upside break, ETH could find itself resisted at points $144, $183 and $224. However, a decline could push the coin deeper into the bearish realm, towards its December 2018 lows.