
Following Bitcoin’s massive fall on 25 November, Ethereum fell by around 10 percent. Although the second-largest crypto-asset bounced back right after the crash, over the period of November, Ethereum’s valuation has dropped from a high of $196.68 to $150.92, at press time.
However, while the notion is bearish at the moment, several bullish signs are surfacing in the charts.
1-hour chart
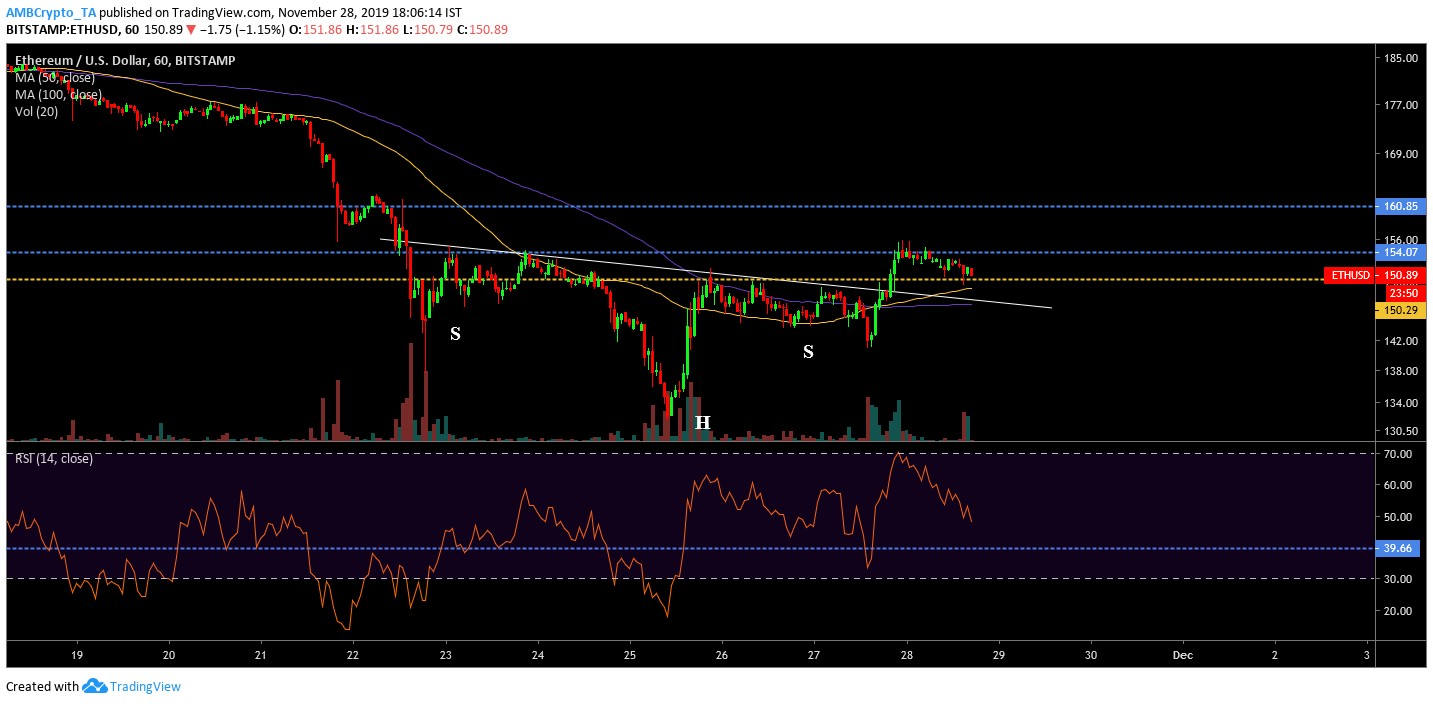
Source: ETH/USD on Trading View
The 1-hour chart for Ethereum recorded three different lows on 22nd, 25th, and 27th November, respectively. A major dip was observed on 25 November and after the minor drop on the 27th, the valuation continued to scale upwards. Over the time period, however, the price movement of ETH gave rise to an inverted Head and Shoulder pattern and at press time, the pattern was positively breached.
The Inverted Head and Shoulder pattern was an indication of a bullish breakout and at press time, ETH’s price was above the neckline of the formation. The immediate support for ETH was placed at $150.29, which was close to its present valuation. The breakout had already surfaced on the 1-hour chart, and the resistance at $154.07 should be tested soon enough.
The Moving Average exhibited a clear bullish sign as the 50-Moving Average completed a bullish crossover with the 100-Moving Average on 27 November.
Although the Relative Strength Index or RSI was declining at press time, a positive bounce should ensue before breaching the support at 39.66.
1-day chart
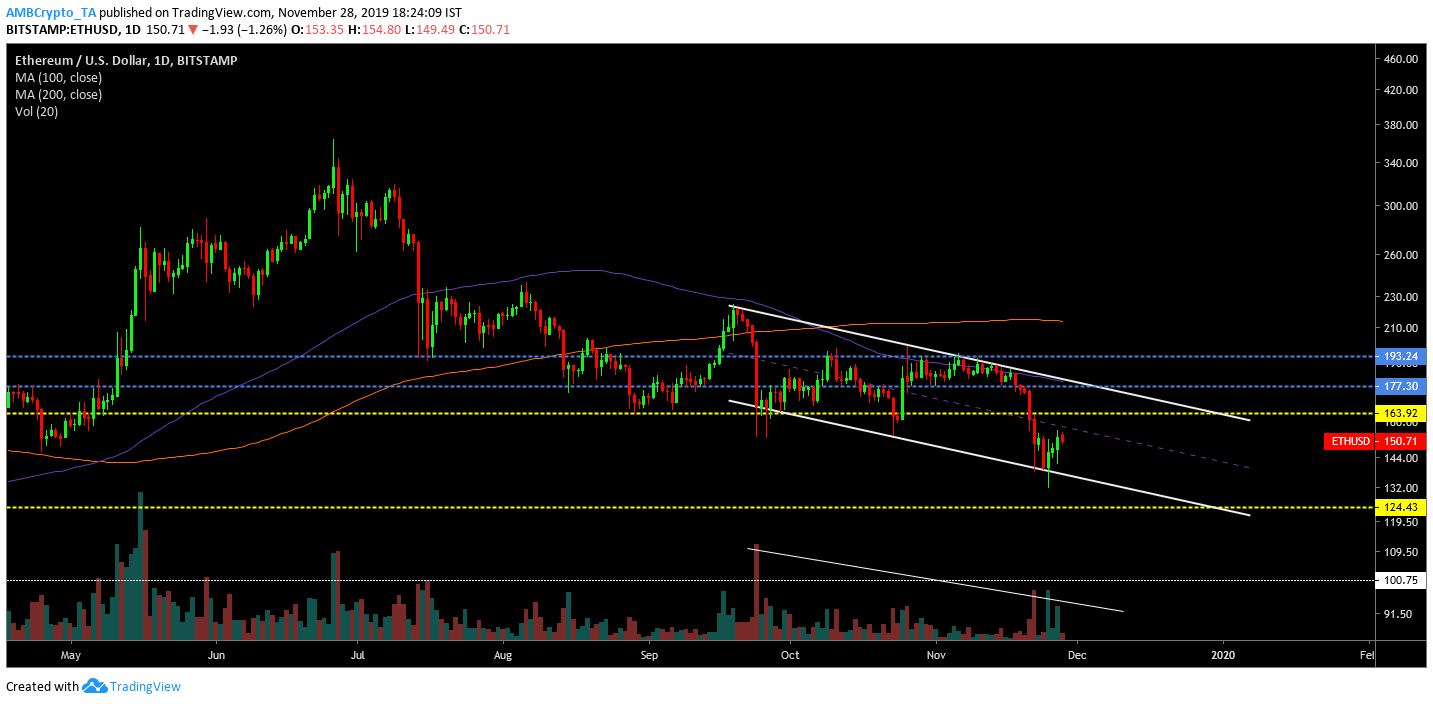
Source: ETH/USD on Trading View
The 1-day chart for Ethereum indicated a steady decline in valuation since the end of September. However, under observation, the long-term chart for ETH exhibited a descending channel formation. The descending channel had formed clear lower lows at three different places in the trend line and the possibility of a bullish breakout was evident on the chart. The decreasing trading volume confirmed the validity of the pattern.
The bullish sentiment of the 1-hour chart was shared by the long-term projections, but the Moving Averages suggested that the bullish breakout may not break past the major resistance at $193.24. The 200-Moving Average was mediating above the 100-Moving Average. Hence, the breakout may lack significant momentum. At press time, the immediate resistances were placed $163.92 and $177.30.
Conclusion
November is coming to an end and the bearish sentiment may subside with it as well. The next few weeks will be interesting to observe ETH’s price as the bulls may have a major say as the year comes to an end.