
In the volatile world of cryptocurrencies, one where a 24-hour price surge of over 50% is commonplace, defining ‘value’ can be difficult for any investor. However, there are a few metrics that claim to make this process simpler.
Financial metrics provider Token Terminal recently shared a report identifying the top-performing protocols in the market based on their Price to Sales (P/S) ratio. The P/S ratio compares a protocol’s market cap to its revenues. A low ratio would imply that the protocol is undervalued and vice versa.
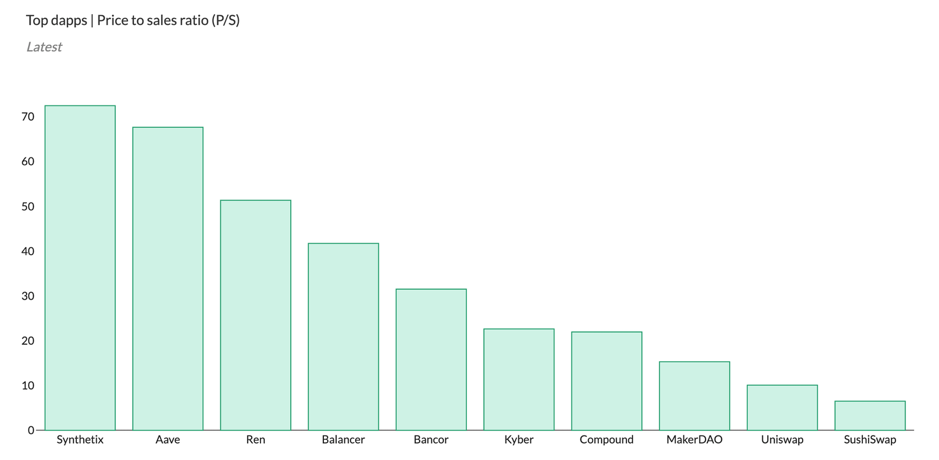
Source: Token Terminal
The lowest-ranked protocol was SushiSwap, making it the most undervalued protocol according to this metric, followed by Uniswap and Maker.
Interestingly, the data also suggested that over the past few months, Maker has gone from having a high P/S ratio to being third on the list, after raising the stability fees for DAI.
Meanwhile, consistently high daily revenues for Uniswap during Q3 and Q4 of 2020 meant that fluctuations in the market cap have been the primary driver for changes in the P/S ratio.
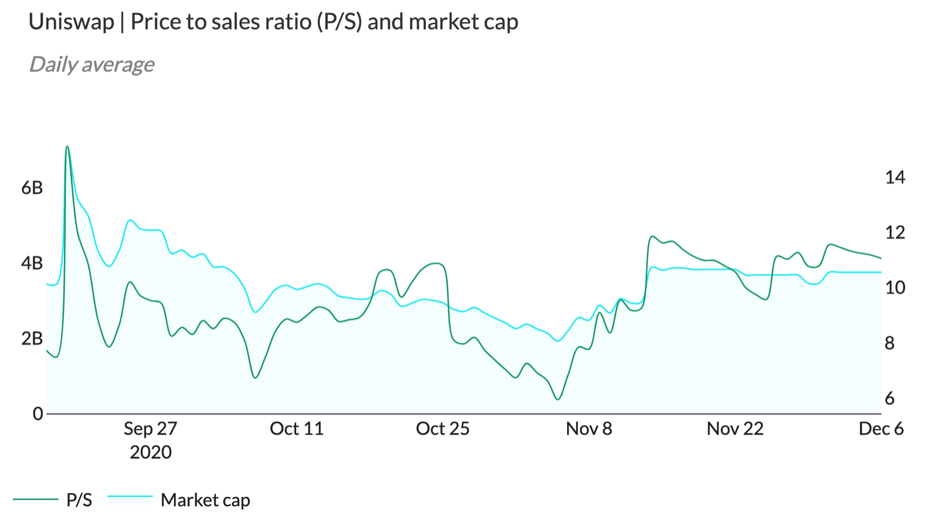
Source: Token Terminal
The chart attached herein plotted the market cap and P/S and underlined that there is a direct correlation between the two. This would suggest that Uniswap’s revenues have stayed consistently high since the launch of the $UNI token.
On the other side of the spectrum was Synthetix with a P/S ratio of over 70%. This number was high due to the fact that the protocol started off with a relatively low market cap and a high P/S ratio, after the launch of Synthetix v2. Although revenues were low in the beginning, they have since trended upwards.
Although this metric is best suited to examine early stage protocols, it is worth examining how Ethereum performed, considering it is the platform where much of the action on DeFi takes place.
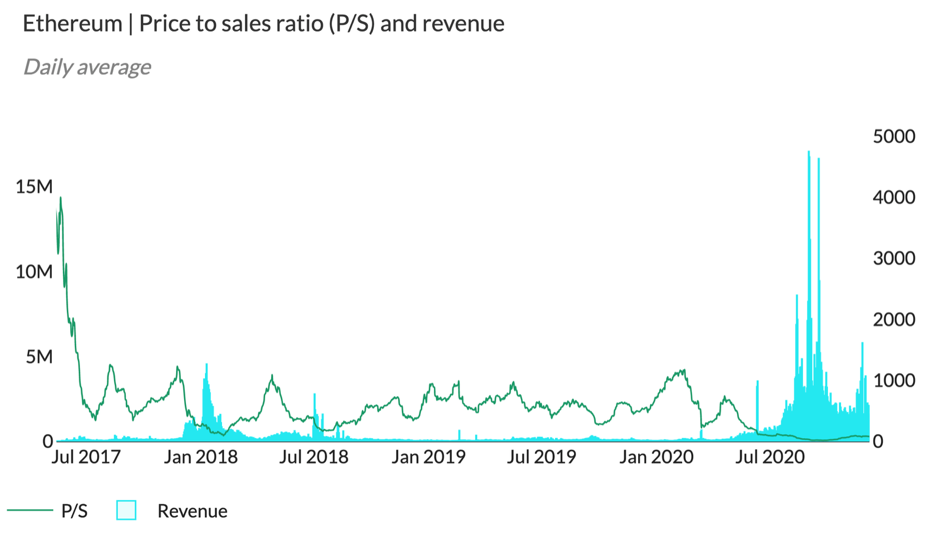
Source: Token Terminal
According to the above charts, Ethereum’s P/S ratio has fallen drastically over the past few months and is even on par with some of the market’s leading DeFi protocols. Daily revenues have also been consistently high during Q2 to Q4 of 2020, something that implies significant growth of late.
What does this entail? Well, the data would suggest that Ethereum’s market cap is yet to catch up with the growth in the Ethereum ecosystem.