
The cryptocurrency market has been struggling to see any strong bullish momentum in the past week, as Bitcoin and major altcoins have been in a consolidating phase ever since the drastic fall on 24th September. Ethereum performance was no different as its price fell from $197.29 on 11th October and went as low as $168.15 on 18th October. However, the altcoin looked set for a short term bullish burst on the 1-hour and 4-hour price charts.
At press time, Ethereum was trading at $174.41 with a minimal gain of 0.97% on the 24-hour price chart. The total market cap of ETH stood at $18.87 billion as per CoinMarketCap data.
1-Hour Price Chart
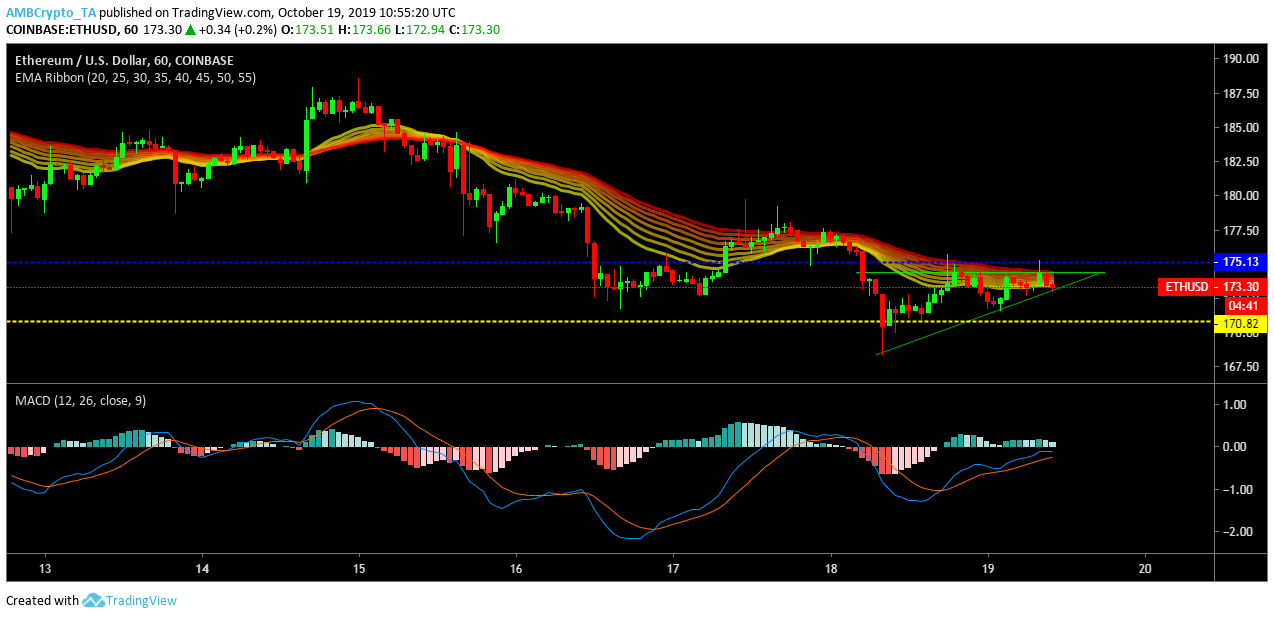
Source: ETH/USD on TradingView
On the one-hour price chart, Ethereum formed an ascending triangle which is characterized by a constant high formed at $174.38 and higher lows meeting the triangle at $168.30, $171.63 and $173.03. The formation of an ascending triangle is considered bullish as it is often followed by an upward price breakout.
Ema ribbon suggested that the volatility has been on a decline and once the price breakout from the ascending triangle the ema-ribbon might act as a support. At press time, the ribbons were in between and were neither acting as resistance or support.
MACD line had a bullish cross-over on 18th October and it has remained above the signal line since then, with the breach of the ascending triangle on the cards for Ethereum.
4-Hour Price Chart
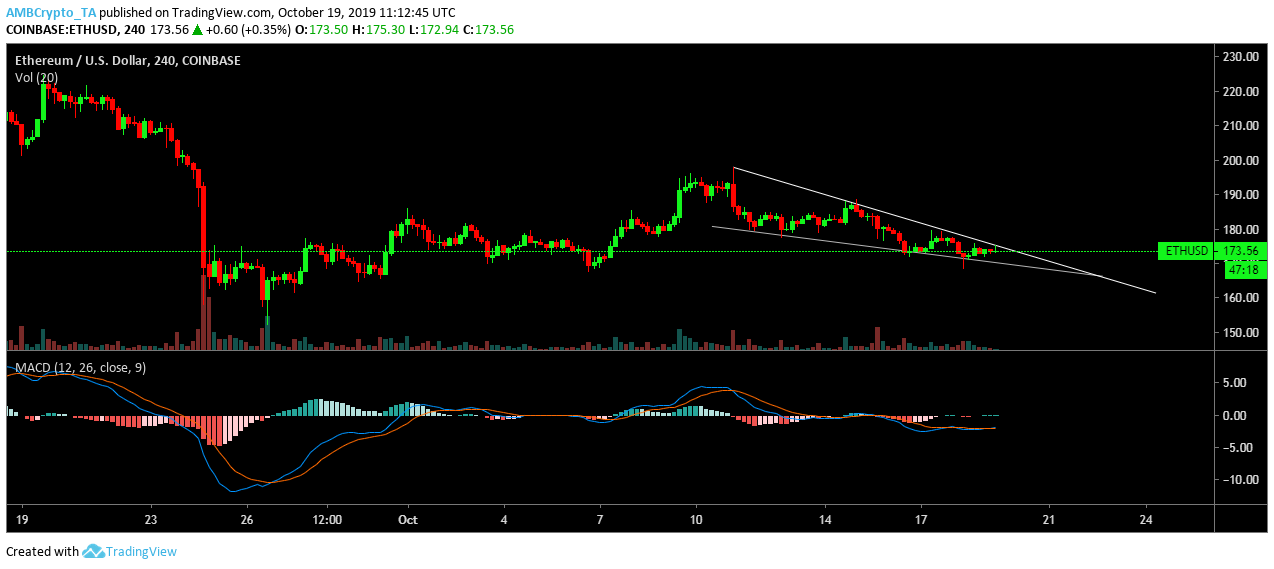
Source: ETH/USD on TradingView
On the 4-hour price chart, Ethereum exhibited a falling wedge pattern which is characterized by formation of higher lows meeting the wedge at $197.50, $187.85 and $175.31. Lower lows met the wedge at $179,36, $173.18, and $170.87. Falling wedge pattern is often followed by a bullish price breakout, thus Ethereum might see a bullish price breakout in the short term.
MACD line had a bullish cross over, which suggested that the market sentiments were bullish in the short term.
Conclusion
Ethereum looked set for a bullish burst on both 1-hour and 4-hour price chart with the formation of two patterns, where a breakout from these patterns are often in green. MACD indicator confirmed the bullish sentiment in the market.