
Bitcoin might be taking most of the attention but Ethereum is not being a pushover at the moment. A recent surge over $600 is re-vitalizing its market as well, and now external developments might be pushing Ether to new heights in 2020. In this article, we’ve analyzed Ethereum’s current market structure, alongside the key factors which may assist in further value acceleration.
Ethereum 1-day chart
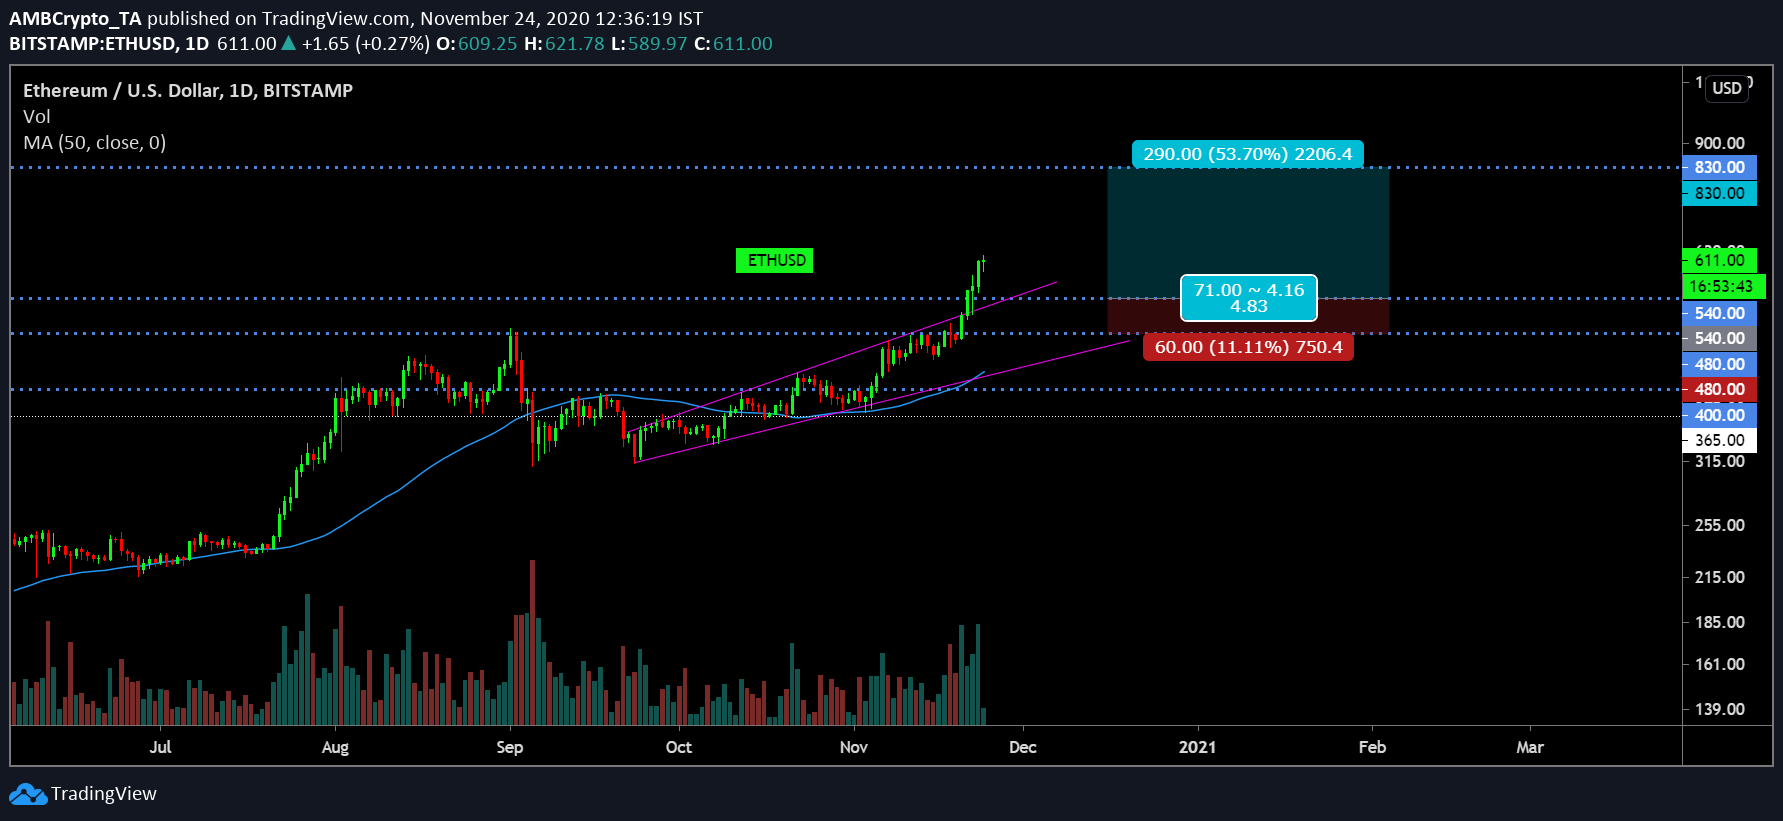
Source: ETH/USD on Trading View
During the first week of September, Ethereum attained its yearly high of $489 before eventually dropping down to $313 after a few weeks. Since then $489 has been the target but the asset struggled to break past it between 6th-19th November. However, after the 19th, Ethereum has been on a tear. Quickly taking over the $489 mark, Ethereum completed its surge above $500, and on the 23rd of November, Ethereum broke above the $600 mark.
Ether’s price movement suggested the formation of an ascending broadening wedge, but it was recently breached as the altcoin marched above $540. With the 50-moving average coming across completely bullish alongside significant trading volume, the bullish rally may continue after a minor correction.
Market Reasoning
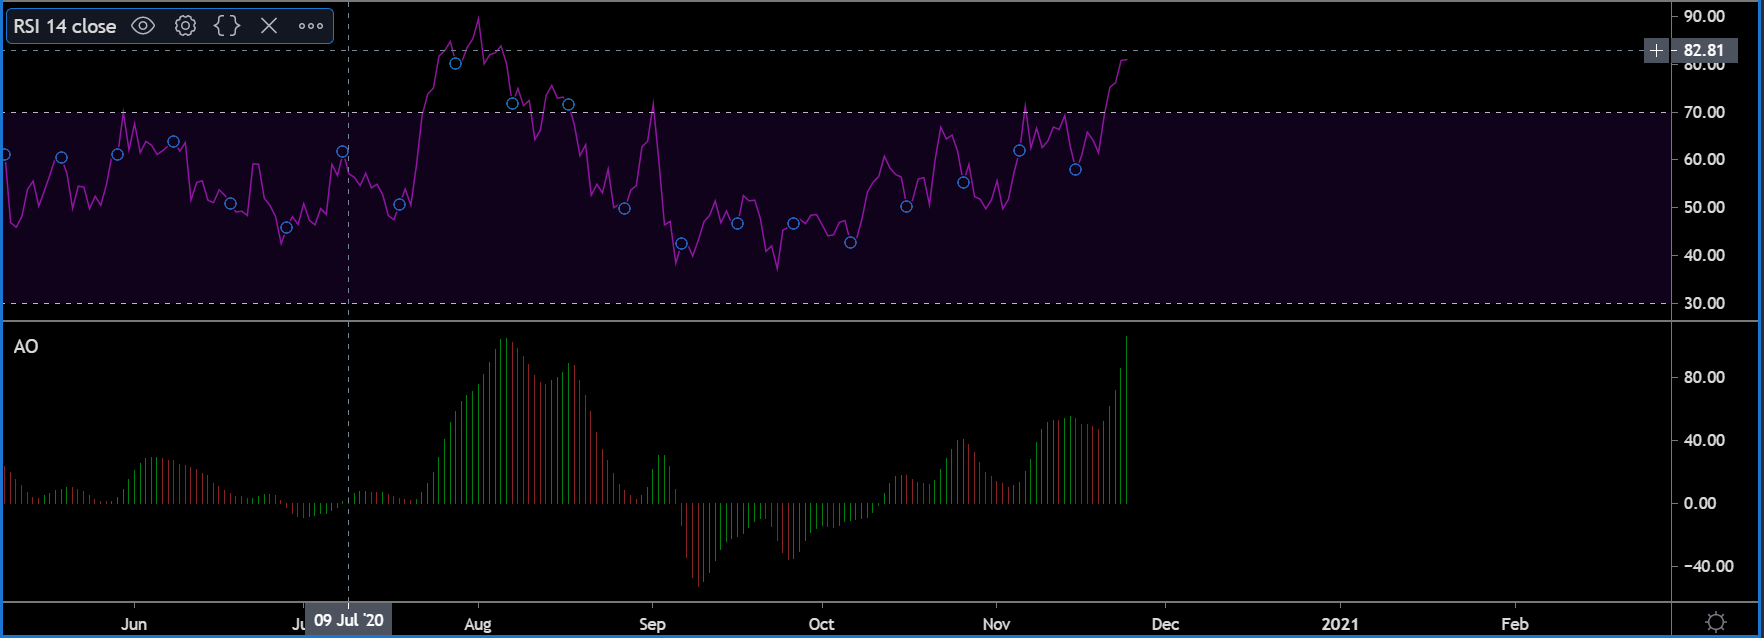
Source: ETH/USD on Trading View
Market Indicators suggested the Ether’s value is possibly reaching a point of correction, which will be exhibited eventually. Relative Strength Index or RSI is currently at an overbought zone and Awesome Oscillator or AO suggested high bullish momentum. While a pullback will take place, other important factors will keep the rally bullish.
As reported, Ethereum 2.0 deposit contracts have been filled on time, for ETH 2.0 launch on the 1st of December. More than 200k ETH were deposited within 14 hours to complete the quota, which suggests that users were backing Ethereum.
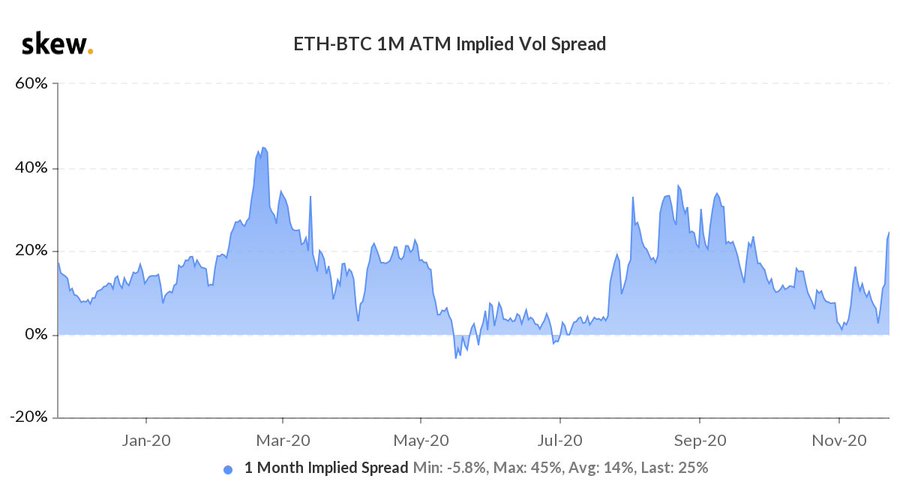
Source: Skew
Lastly, Ethereum’s implied volatility with respect to Bitcoin has also taken off at press time. While it indicates that price swings can take place in both directions, the relative bullishness of the market is also indicative of one way; which is up.
Important Range
Resistance: $830, $700(Psychological)
Support: $540, $480, $400
Entry Position for Long Trade: $540
Stop Loss: $480
Take Profit: $830
Risk/Reward Ratio: 4.83x
Conclusion
While a minor drop may take place in the charts, before the end of 2020, Ethereum could possibly attain its next resistance level at $830.