
Disclaimer: The following price prediction should materialize over the next week.
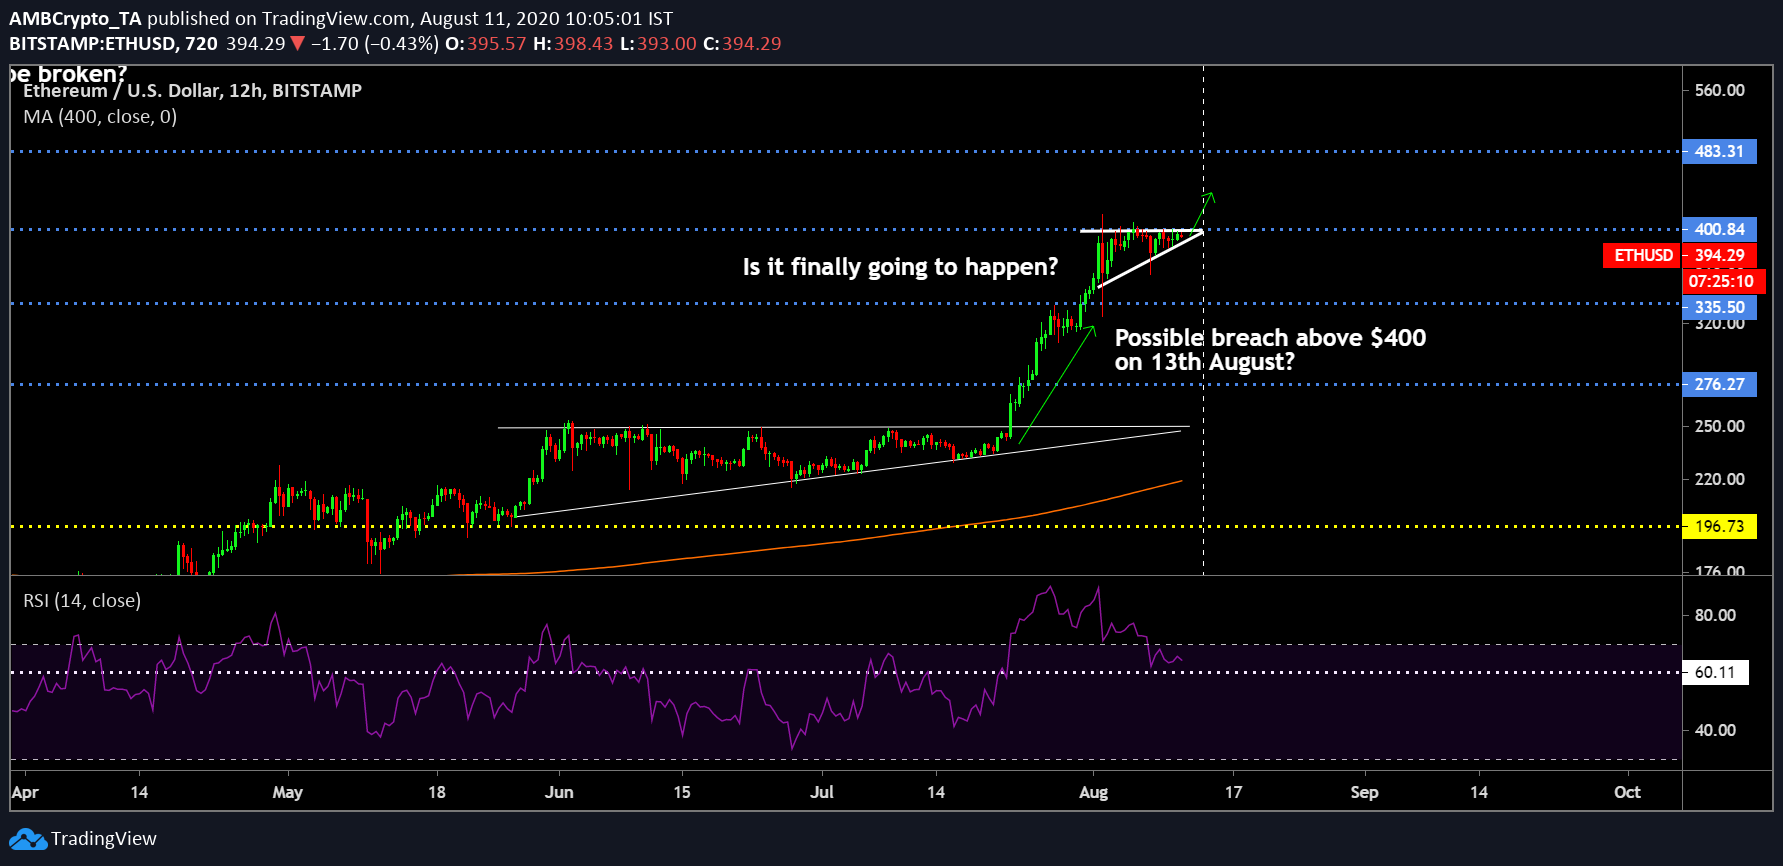
Stuck between the range of $335-$400 since 31st July, the anticipation surrounding Ethereum’s price is beginning to build in the industry. There is a definite divide between the analysts as many were expecting a bullish breakout while some were convinced that the movement is going to be all downwards from now on.
Ethereum 1-day chart
Source: ETH/USD on Trading View
In a previous analysis, we have discussed that the bullish breakout leading up to ETH’s $400 rally happened at the back of an ascending triangle. The price broke out of the bullish pattern taking over resistance at $276, $335 and eventually testing $400.
Now, as the price consolidated between the aforementioned range, the asset is developing another ascending triangle in the charts. At press time, the price squeeze is taking place between the trendlines and if things go according to plan, Ethereum is marked for another breakout above $400 within the next three days, i.e by 13th August.
Relative Strength Index or RSI for the asset also remained at a high, indicative that buyers are still present in the market. Since breaking the 60 mark, the index hasn’t fallen below since 30th July, establishing predominant buying pressure in ETH’s space.
Ethereum Weekly Chart

Source: ETH/USD on Trading View
Ethereum’s weekly chart is currently on a high as well. With a double-bottom pattern developing over the past 2 years, it was finally broken 10 days back when Ethereum marched above $276. However, the key observation in the above chart is that Ethereum has spent the most time between the current range than ever before.
Since being listed on Bitstamp, Ethereum has traded between $335-$400 only twice before, both trading period ending within a week. Right now, Ethereum has been between this range for a better part of 2 weeks, which may suggest two things; a strong bottom or a definite top.
With MACD suggestive of a bullish trend, odds continue to be on the bullish side of the market but over the next few weeks, a definite answer should be revealed for Ethereum.
Conclusion
Ethereum will possibly retest resistance at $400 again by the 13th of August.