
September 2019 saw ETH drop from $220 to $254 in just a matter of days, and Ethereum hasn’t been able to move back above the $210 mark ever since. However, the daily chart indicated that this level might not be out of reach for much longer. CoinMarketCap showed, at the time of writing, ETH with a market value of around $184, and market capitalization of over $18.4 billion.
Ethereum 1-day chart | Scenario 1

Source: ETHUSD on TradingView
Since August last year, ETH has been moving through a descending channel formation with a decreasing volume trend over the duration of the pattern. Channels are considered to be continuation patterns, making it likely that Ethereum will break out through a bullish movement considering ETH entered the pattern through a devaluation move.
The 50-day moving average was seen moving under the price line, which could signal some short-term upward movement. On the surface, MACD indicated a bearish crossover had taken place, and that we could see some downward movement before the ETH breaks above the channel formation. However, a closer look at MACD showed a bullish divergence, which could mean greener pastures for Ethereum in the longer term.
At the time of writing, the upper pattern boundary is guarded by the 200-day moving average, the 78.6% Fibonacci retracement line, as well as the point of control on the volume profile. These are likely to provide heavy resistance to an upward breakout in the next couple of weeks. A move up to the channel trend line could push ETH back into the channel, where it should find support from the 50-day moving average.
At this point, Ethereum will be poised for an upward breakout, and will likely shoot ETH up to the 61.8% Fibonacci retracement line at $210.6 before the end of February. However, there is a chance this level may be reached earlier.
Correlation with Bitcoin | Scenario 2
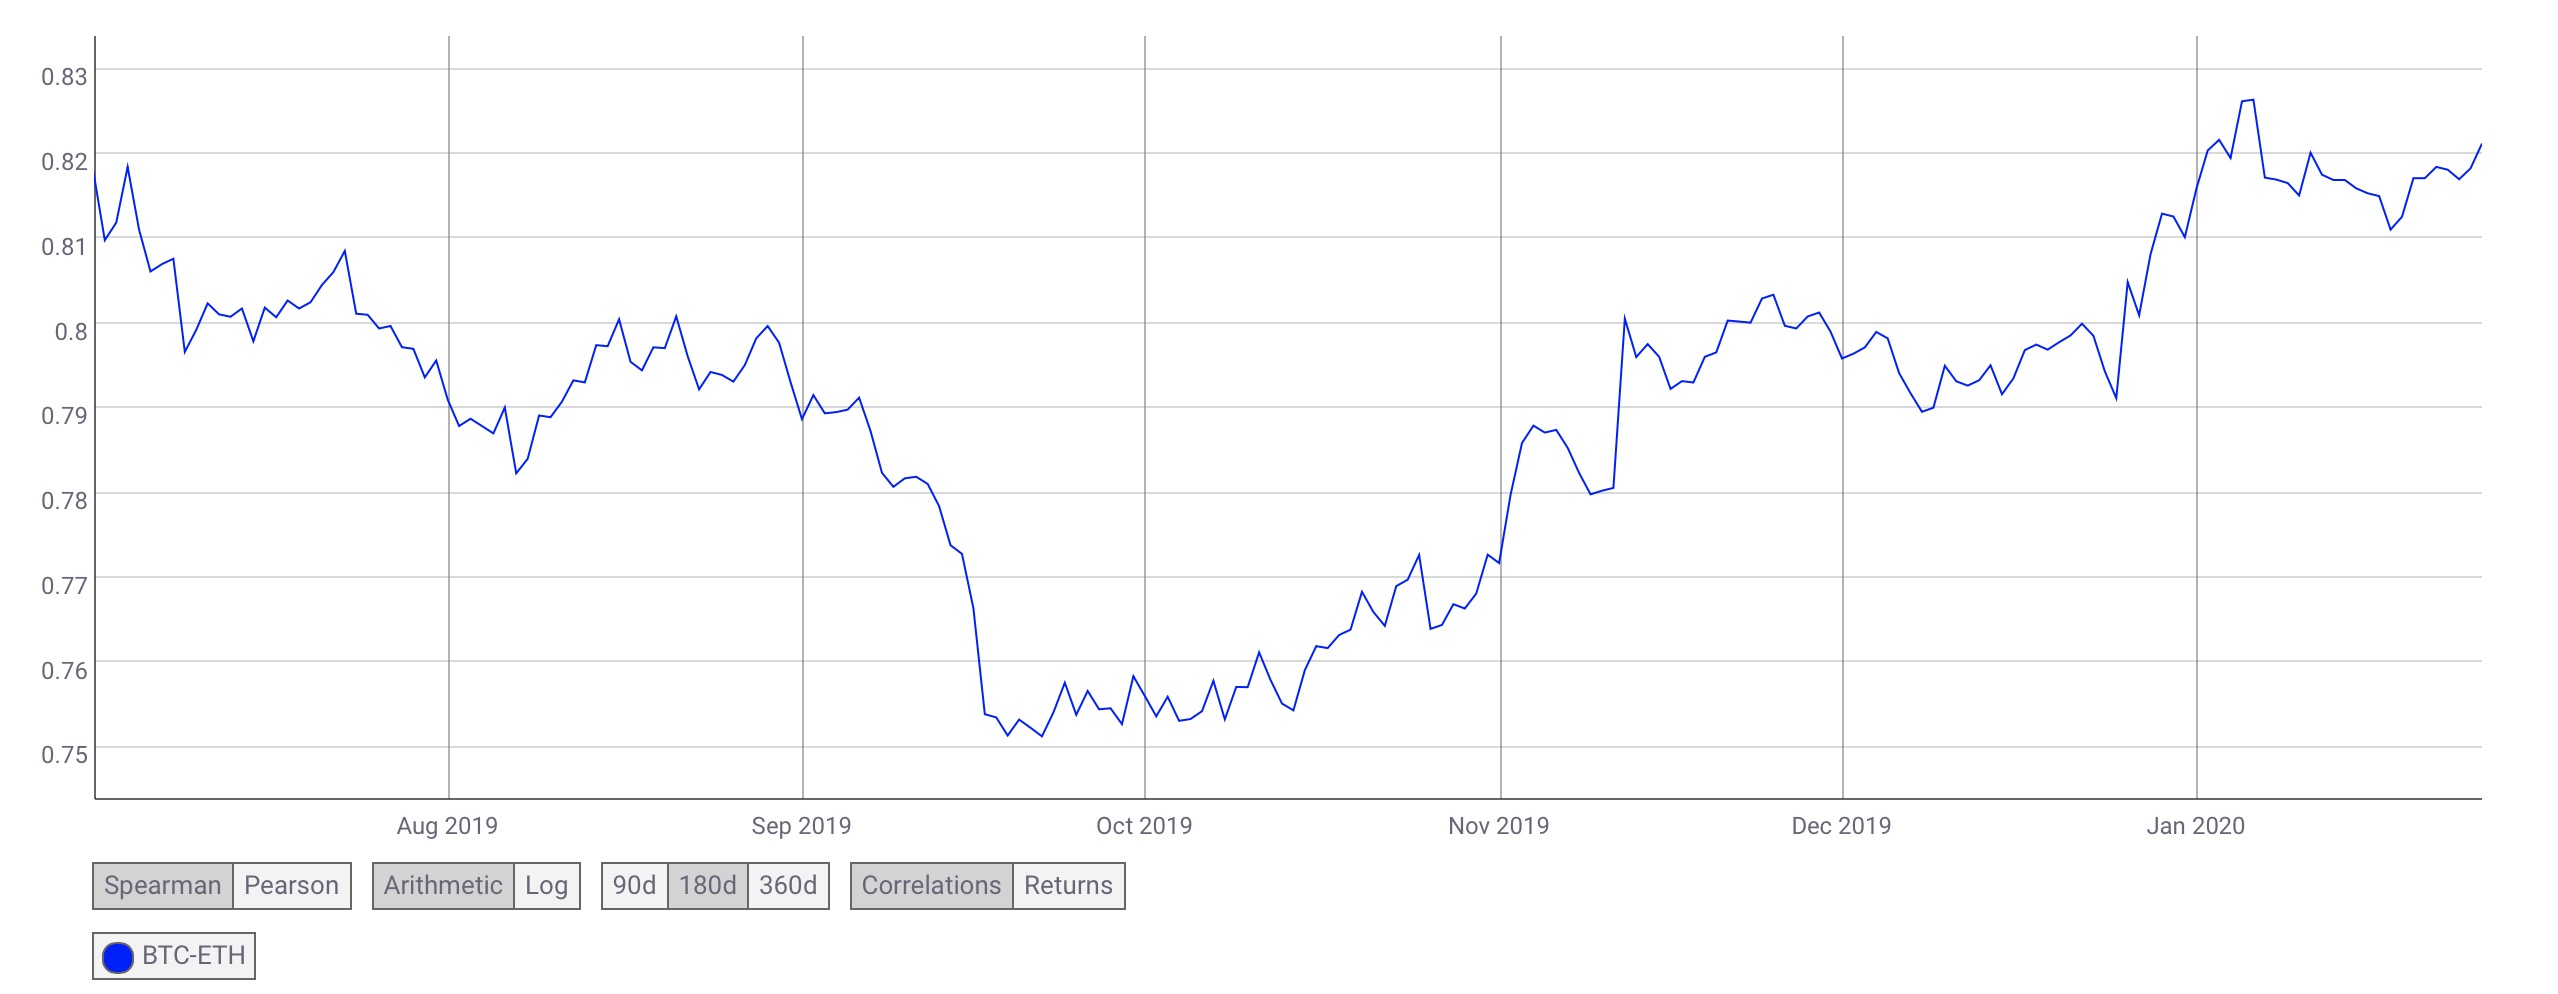
Source: CoinMetrics
According to data analytics firm, CoinMetrics, Ethereum’s correlation with Bitcoin has been on the rise since October 2019, oscillating between 0.81 and 0.82 this month — a level that hasn’t been touched since July last year. With Bitcoin projected to rise to $9000 soon, we could see Ethereum push past the heavy resistance at the channel boundary and jump to the $210.6 mark by the second week of February.
Conclusion
In all likelihood, ETH will be rejected at the channel trend line, pushing the coin down the the 50-DMA. From here, a breakout to the 61.8% Fibonacci retracement line at $210.6 by the end of February looks plausible, especially considering the bullish divergence indicated by MACD, as well as the continuation nature of the pattern. However, if Bitcoin manages to push past the $9000 mark, we could see ETH shoot to the breakout target a little earlier.