
The new year has been good for Ethereum; ETH surged by nearly 42% in just over two weeks from the start of the year. However, the coin has dropped in value since then, and there are signs it could drop further. At the time of writing, CoinMarketCap showed Ethereum with a market capitalization of over $17.42 billion, with over $10.1 billion worth of ETH traded in the last 24 hours.
Ethereum 6-hour chart
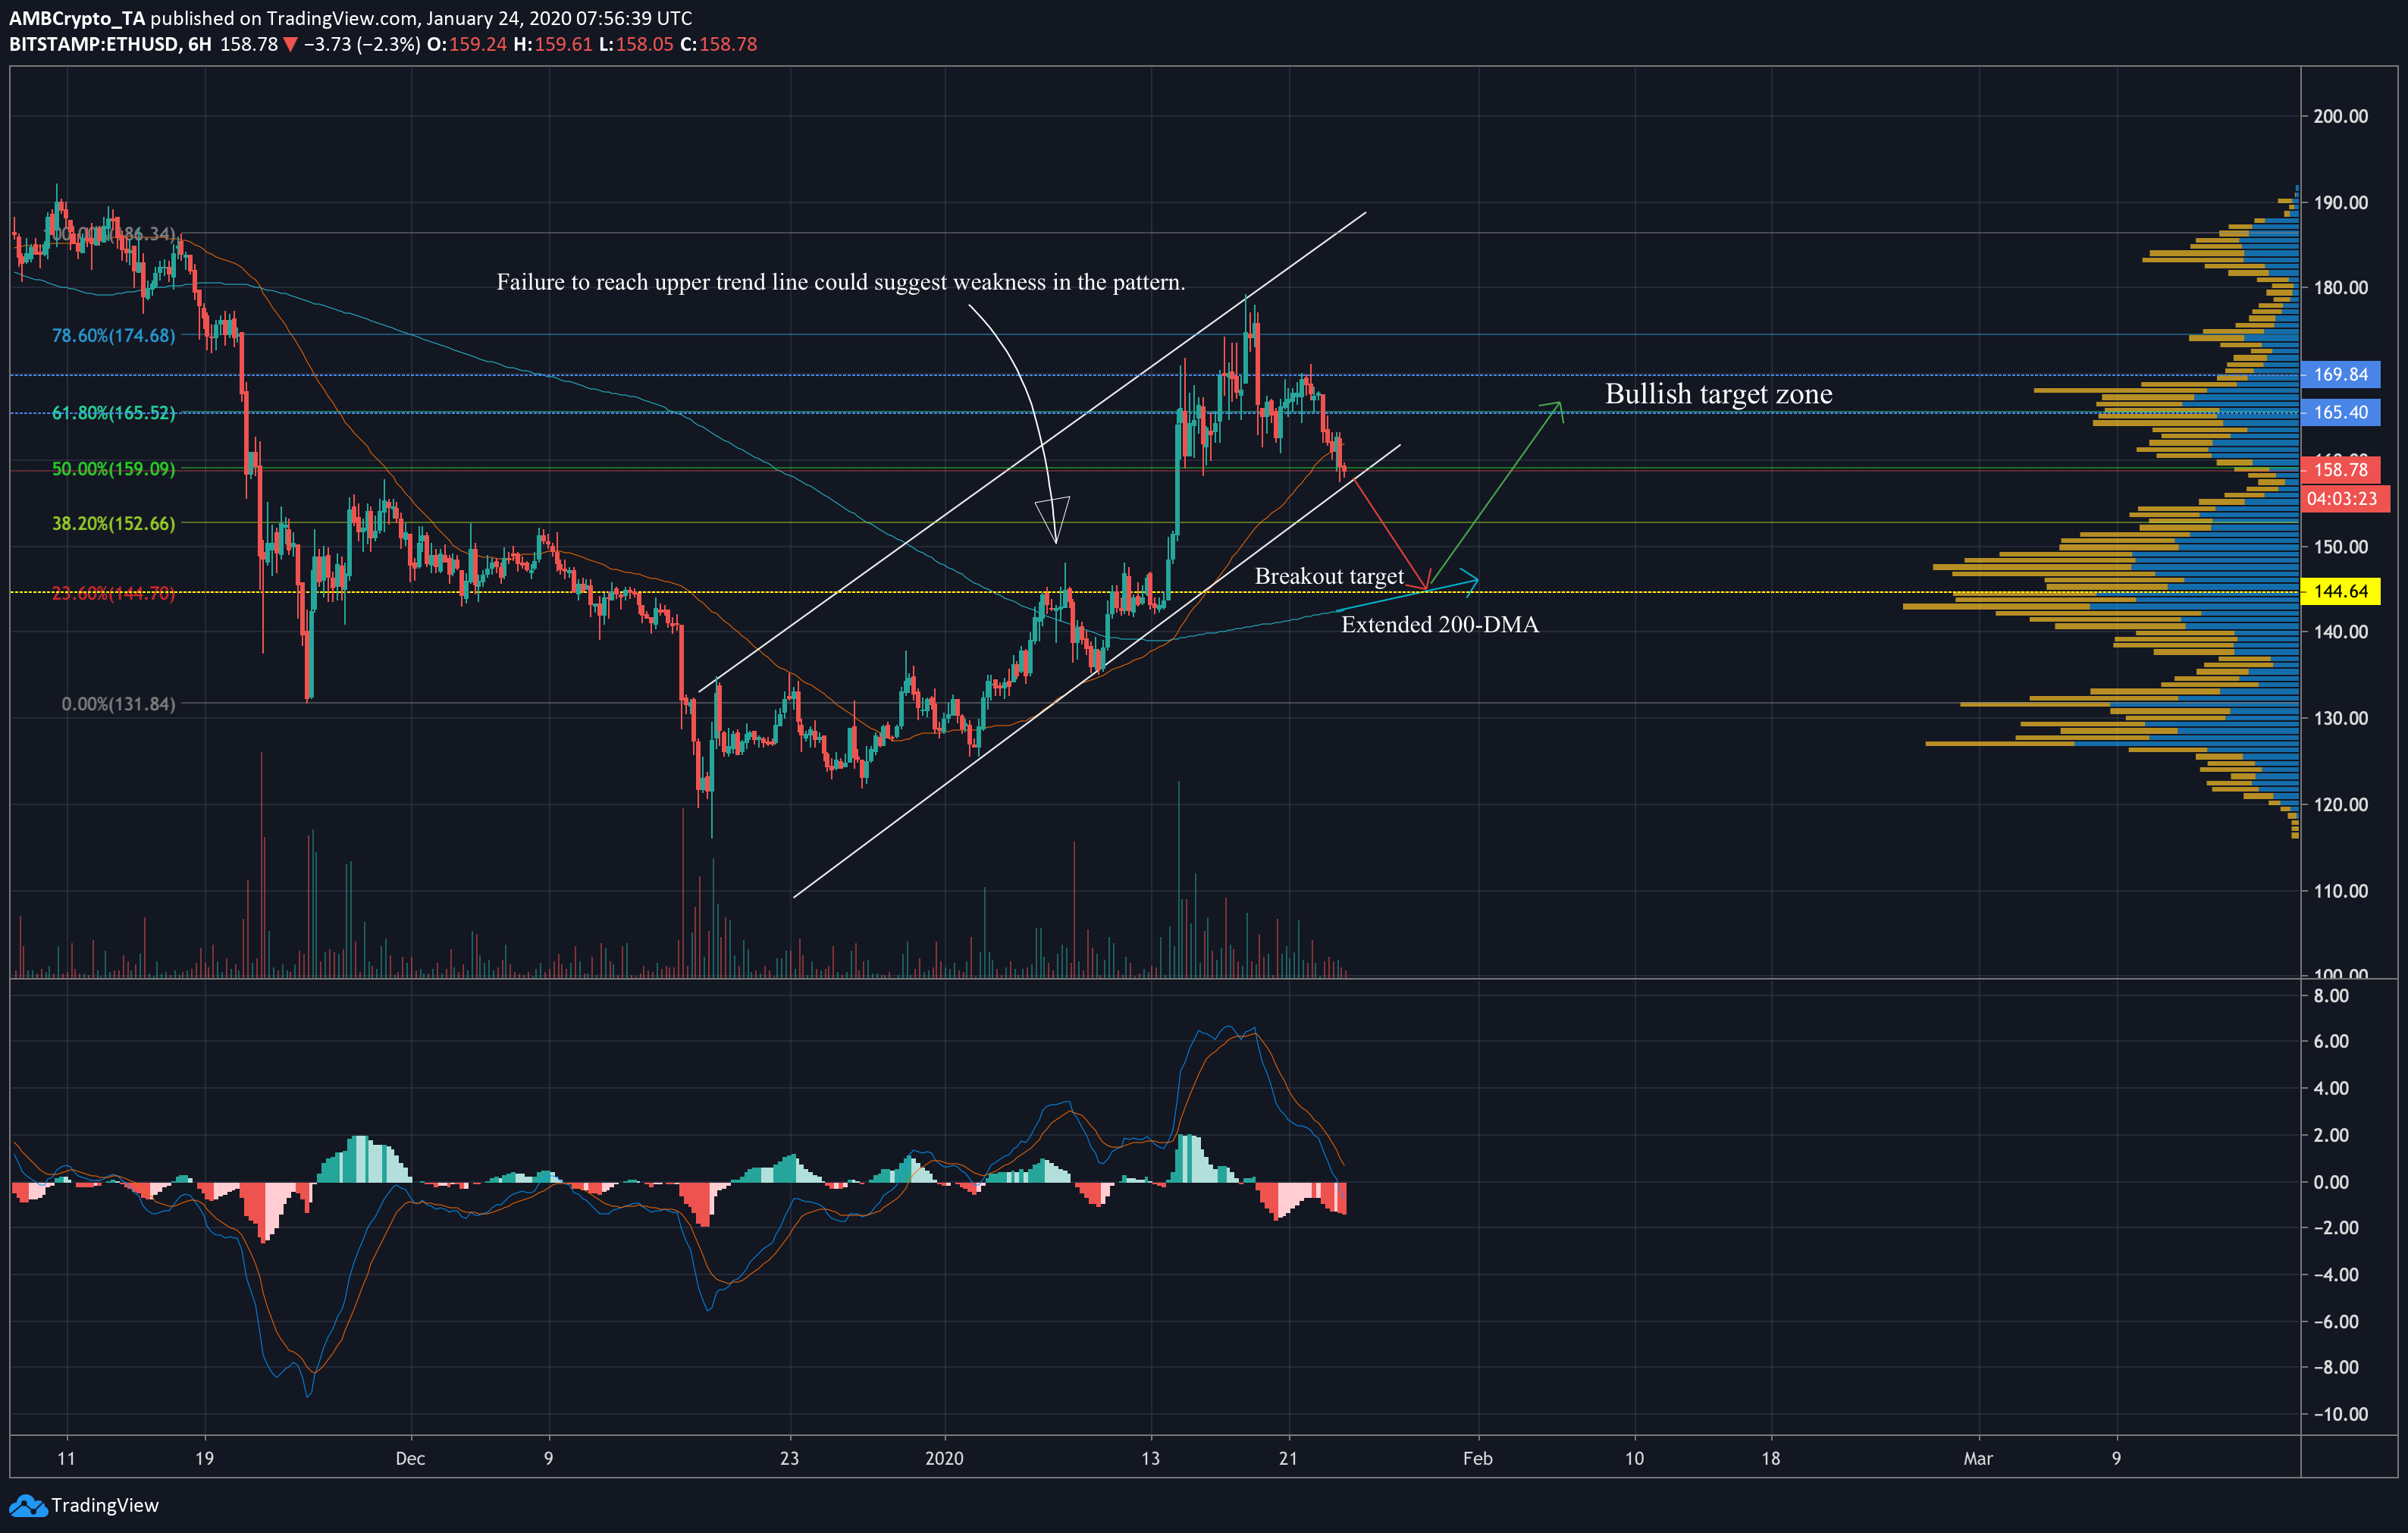
Source: ETHUSD on TradingView
ETH has been moving through an ascending channel formation since late-December last year. While channels are usually continuation patterns, ETH’s inability to subsequently touch the upper trend line in the middle could suggest a weakness in the pattern. Further, the 50-moving average was seen moving above the latest price candle, which could mean that ETH will breakout downward.
The 6h 200-MA was moving well under the price line, which could indicate a more bullish scenario in the slightly less short-term. The trade volumes appeared to spike as the price touched the trend lines, and a spike in sell volume in the next few days could push down to a higher volume node on the volume profile. However, with the 200-MA rising, it could provide support to the price after ETH breaks down from the pattern.
This gives us a breakout target at $144.6, at the 23.6% Fibonacci retracement line, and a bounce back up from here could send ETH to the bullish target zone between $169.84 and $165.4, at the 61.8% Fibonacci line.
1-day chart
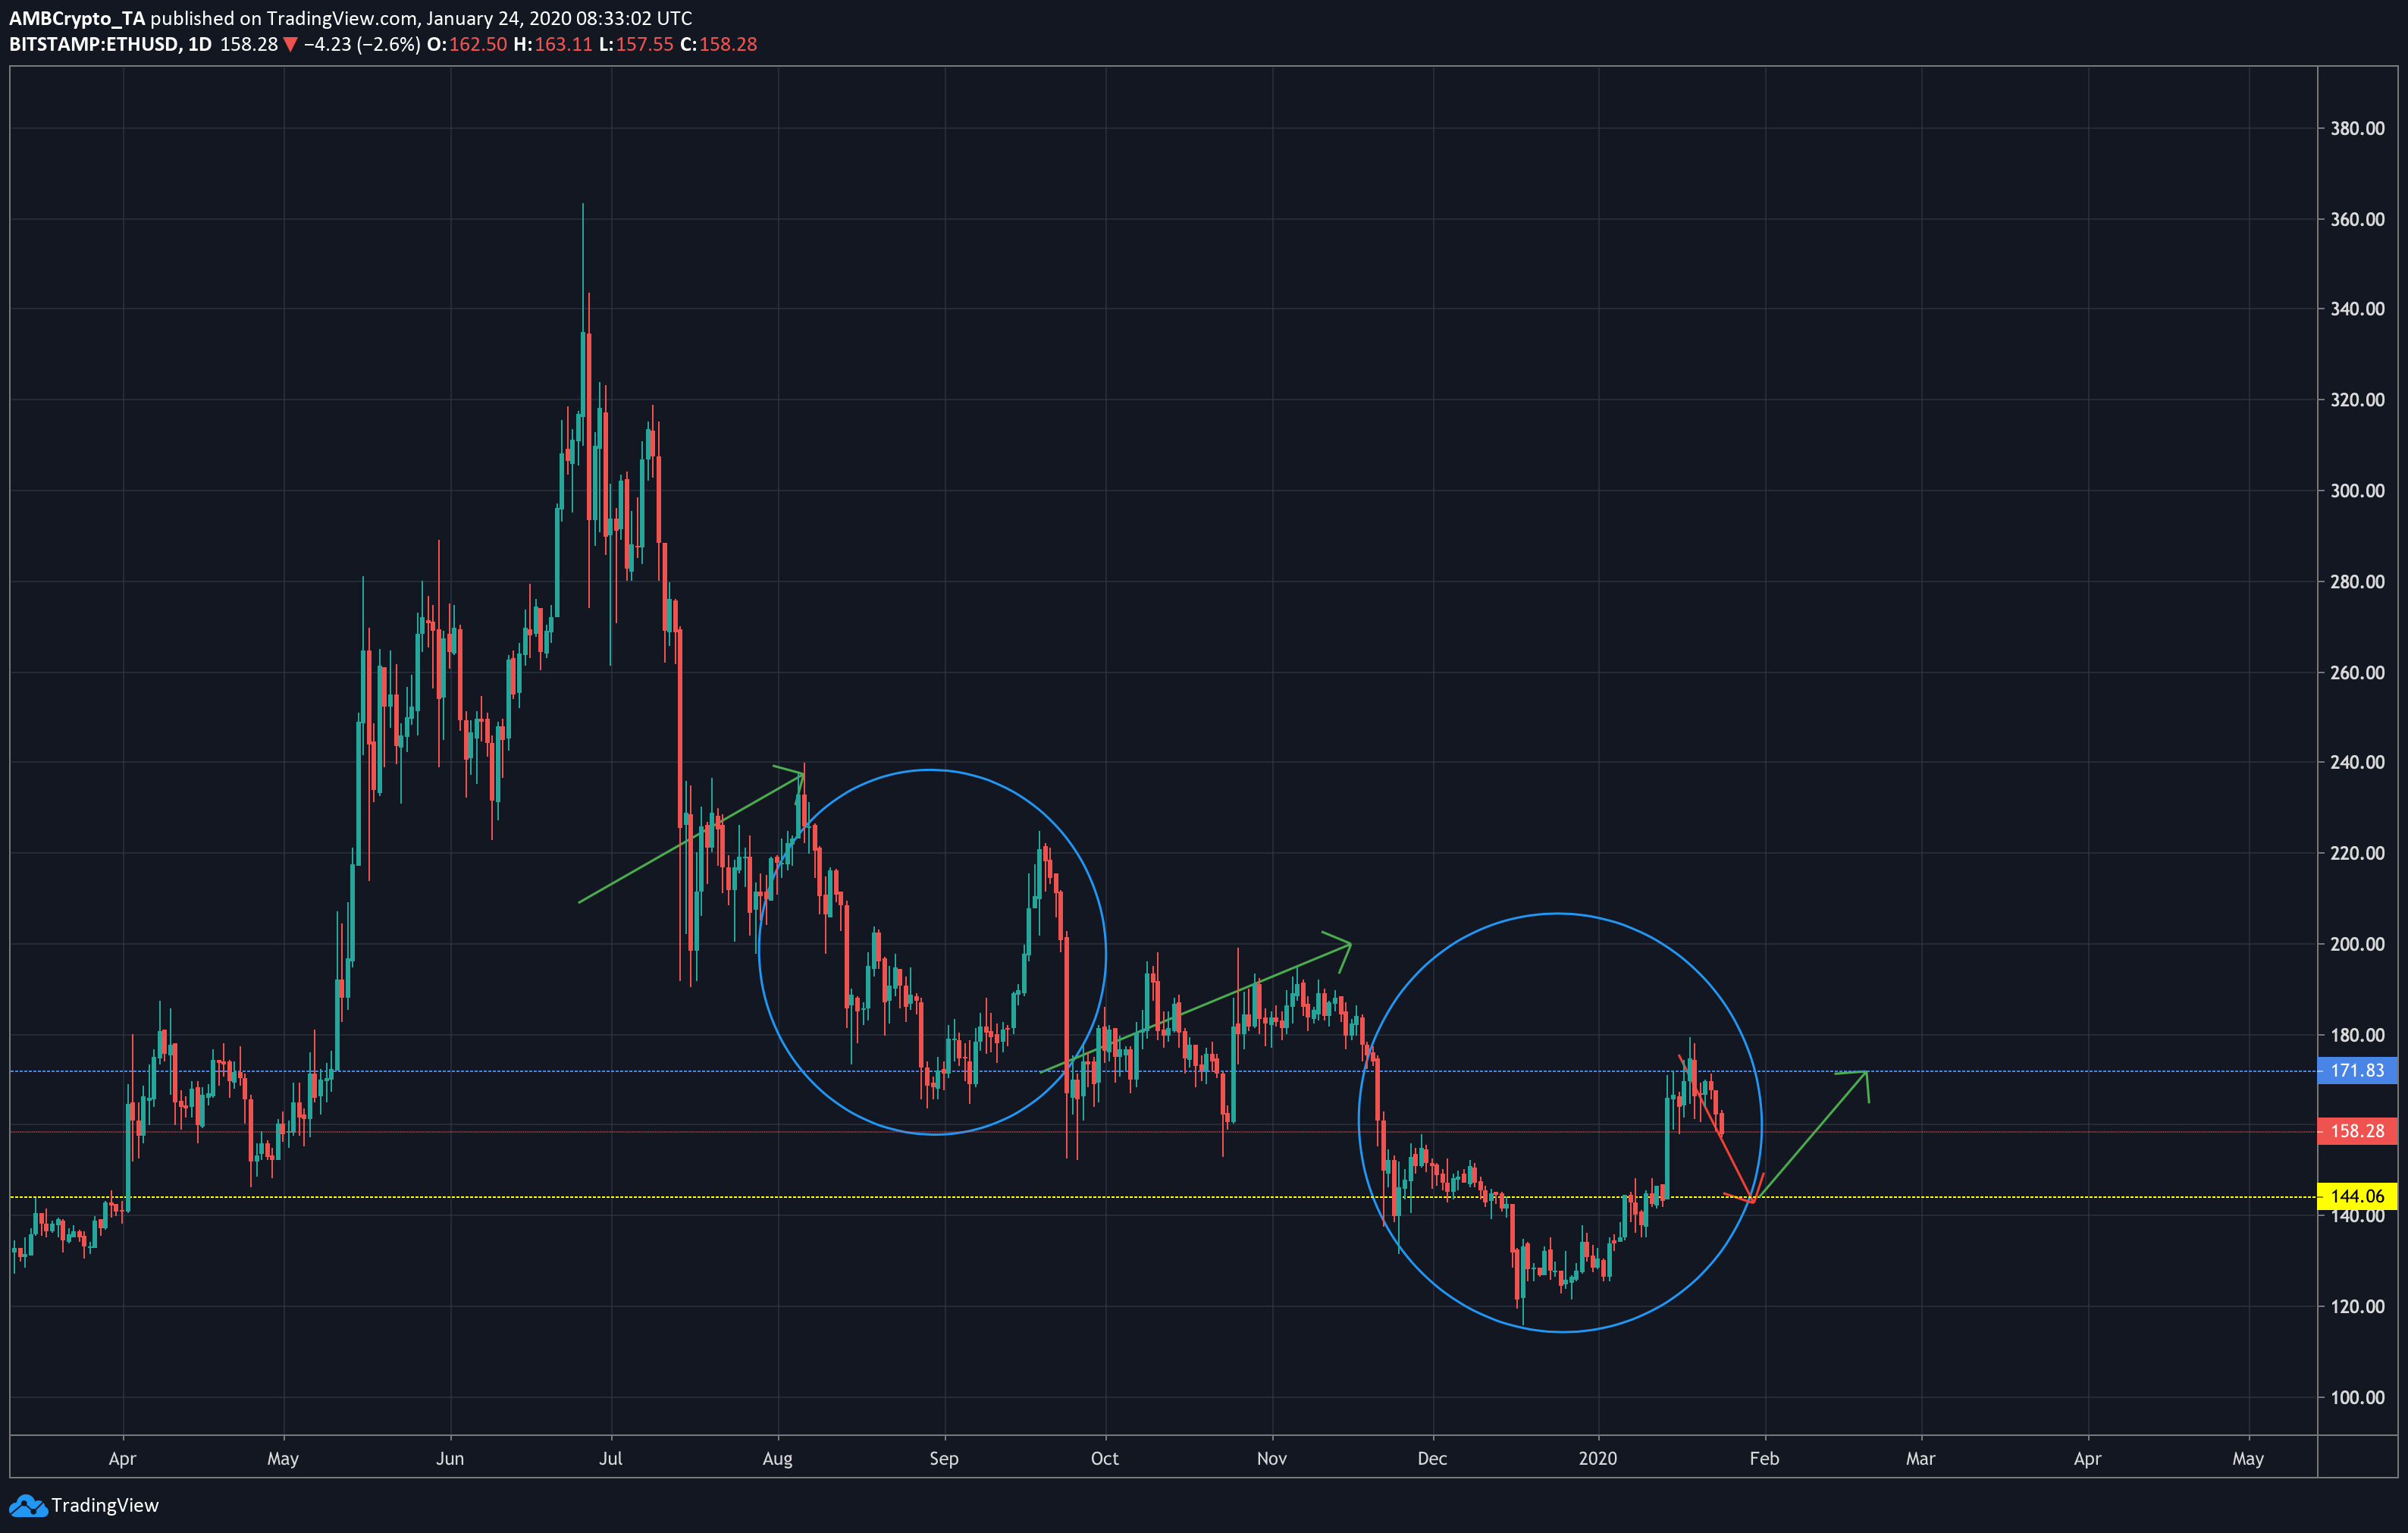
Source: ETH/USD on TradingView
On a higher time-frame chart, it looks as though ETH could be following a fractal. After a small rise in value in July and August, ETH formed an ‘eve’ like pattern, followed by a dip in September. Ethereum saw its value rise once again between October and December before falling into the same ‘eve’ pattern once more. This further enforces the idea that ETH might be bearish for the short-term, and could begin to rise into February.
Conclusion
Ethereum is likely to break down from the ascending channel pattern on the 6-hour chart, down to the $144.64 mark by the end of this month. This is can also be validated on a higher time frame, assuming ETH is moving through the prior fractal. The coin could bounce off the 6h 200-MA, up to between $165.4 and $169.84 as we enter the next month, and likely to $171 by mid-February.