Ethereum Classic, Maker, Bitcoin Price Analysis: 07 September

Bitcoin contributed to a whole host of sell liquidation orders as it dropped from $11,400 to $10,000 a few days ago. On BitMEX alone, about $264 million worth of sell liquidations were registered. Further down the ladder, Ethereum Classic and Maker continued to slide down south as well.
Bitcoin had been able to stave off any dips under $10,000, but it is possible that Bitcoin could face another wave of selling. Bitcoin’s market dominance, at the time of writing, was 60.77%.
Bitcoin [BTC]

Source: BTC/USDT on TradingView
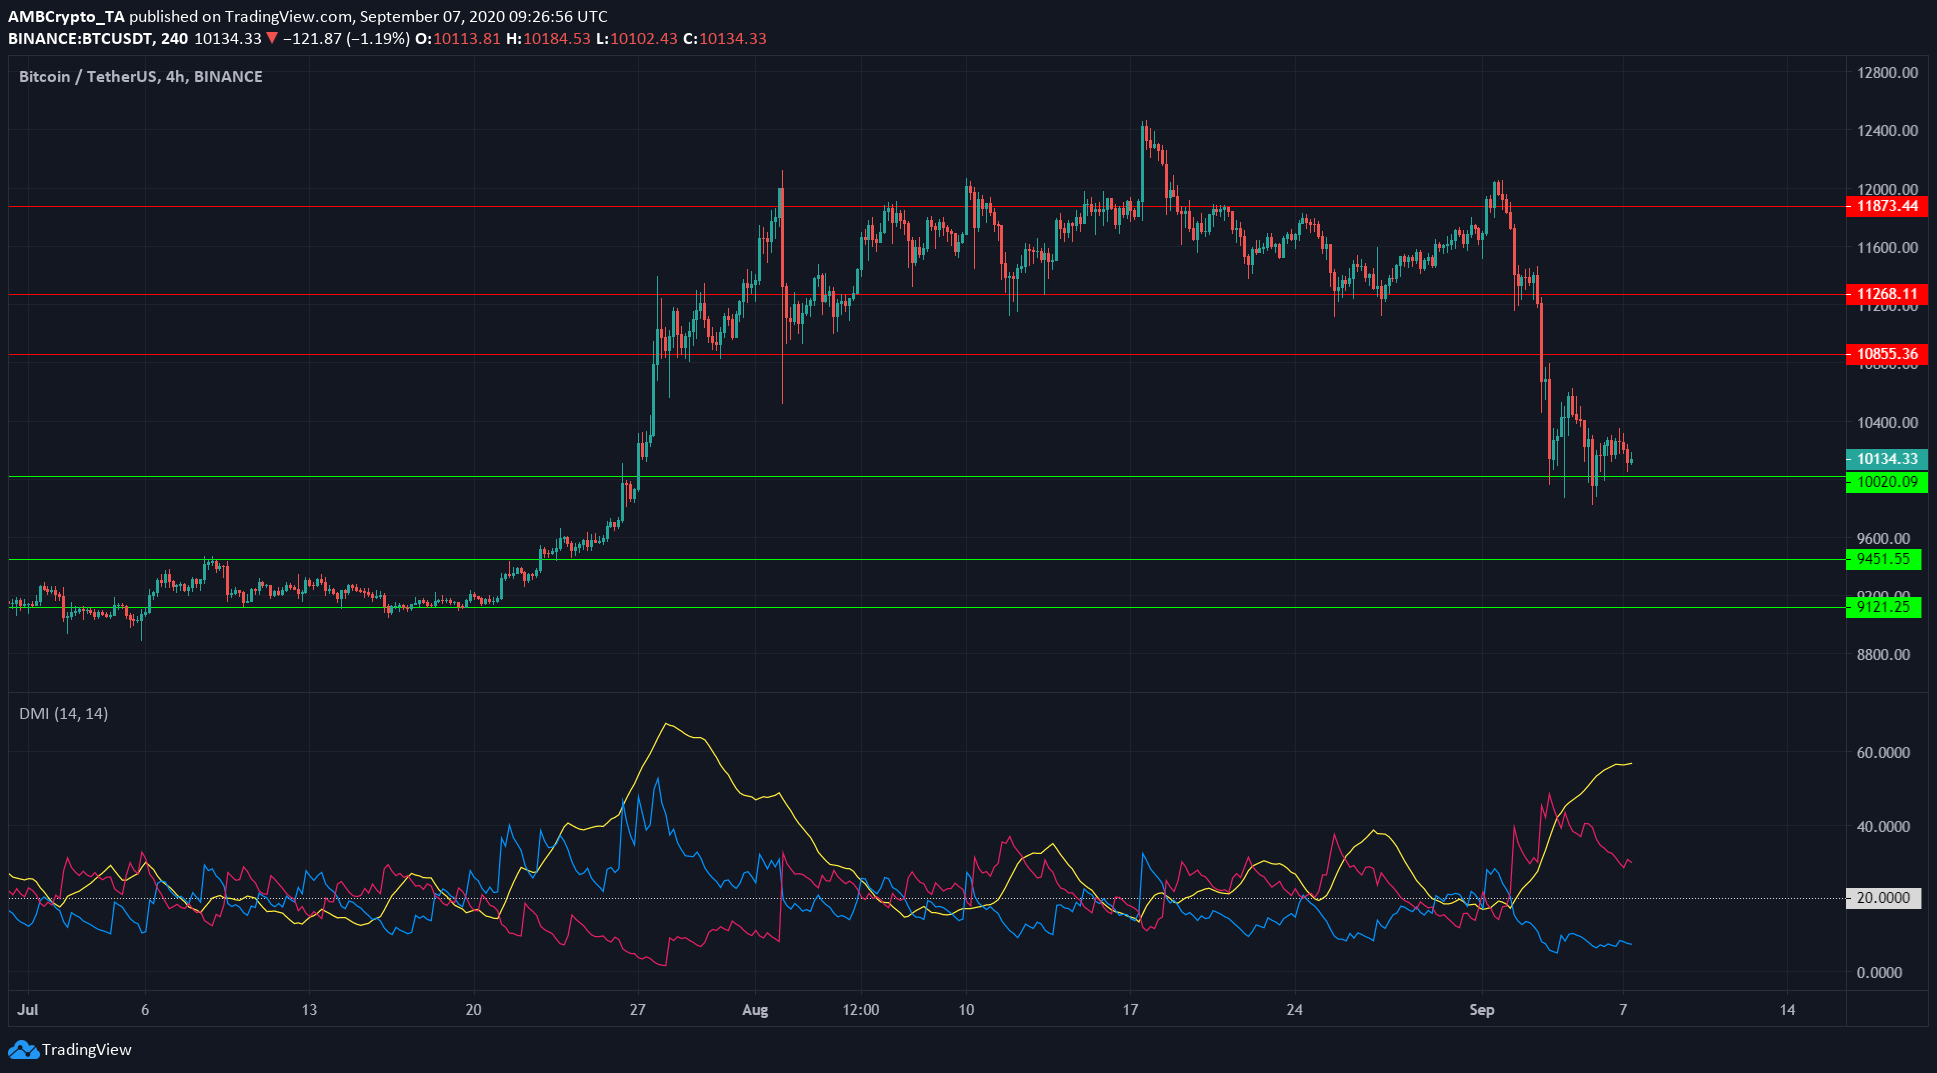
Bitcoin created some long bottom wicks as any dips beneath $10,000 got bought up in the same session. At the time of writing, the support was holding strong on the charts. However, the amount of BTC flowing into exchanges was at its highest since the end of July. Ergo, there is a chance that BTC might see another wave of selling.
On the charts, Bitcoin had established strong levels of support at $10,000, $9400, and $9100 on its way up past these levels.
The Directional Movement Index showed that BTC was still in the grip of a strong downtrend. ADX (yellow) was nearly 60. A value of 20 usually indicates a strong trend. It was also observed that the recent sell-off was as strong as the rise from $9100 to $11,800 over the last week of July.
The second, lower bounce off the $10,000-level is evidence that sellers were able to dominate sessions, despite being so close to a level of support.
A CME gap from $9925 to $9645 also reinforced the idea of another Bitcoin drop on the charts.
Ethereum Classic [ETC]

Source: ETC/USD on TradingView
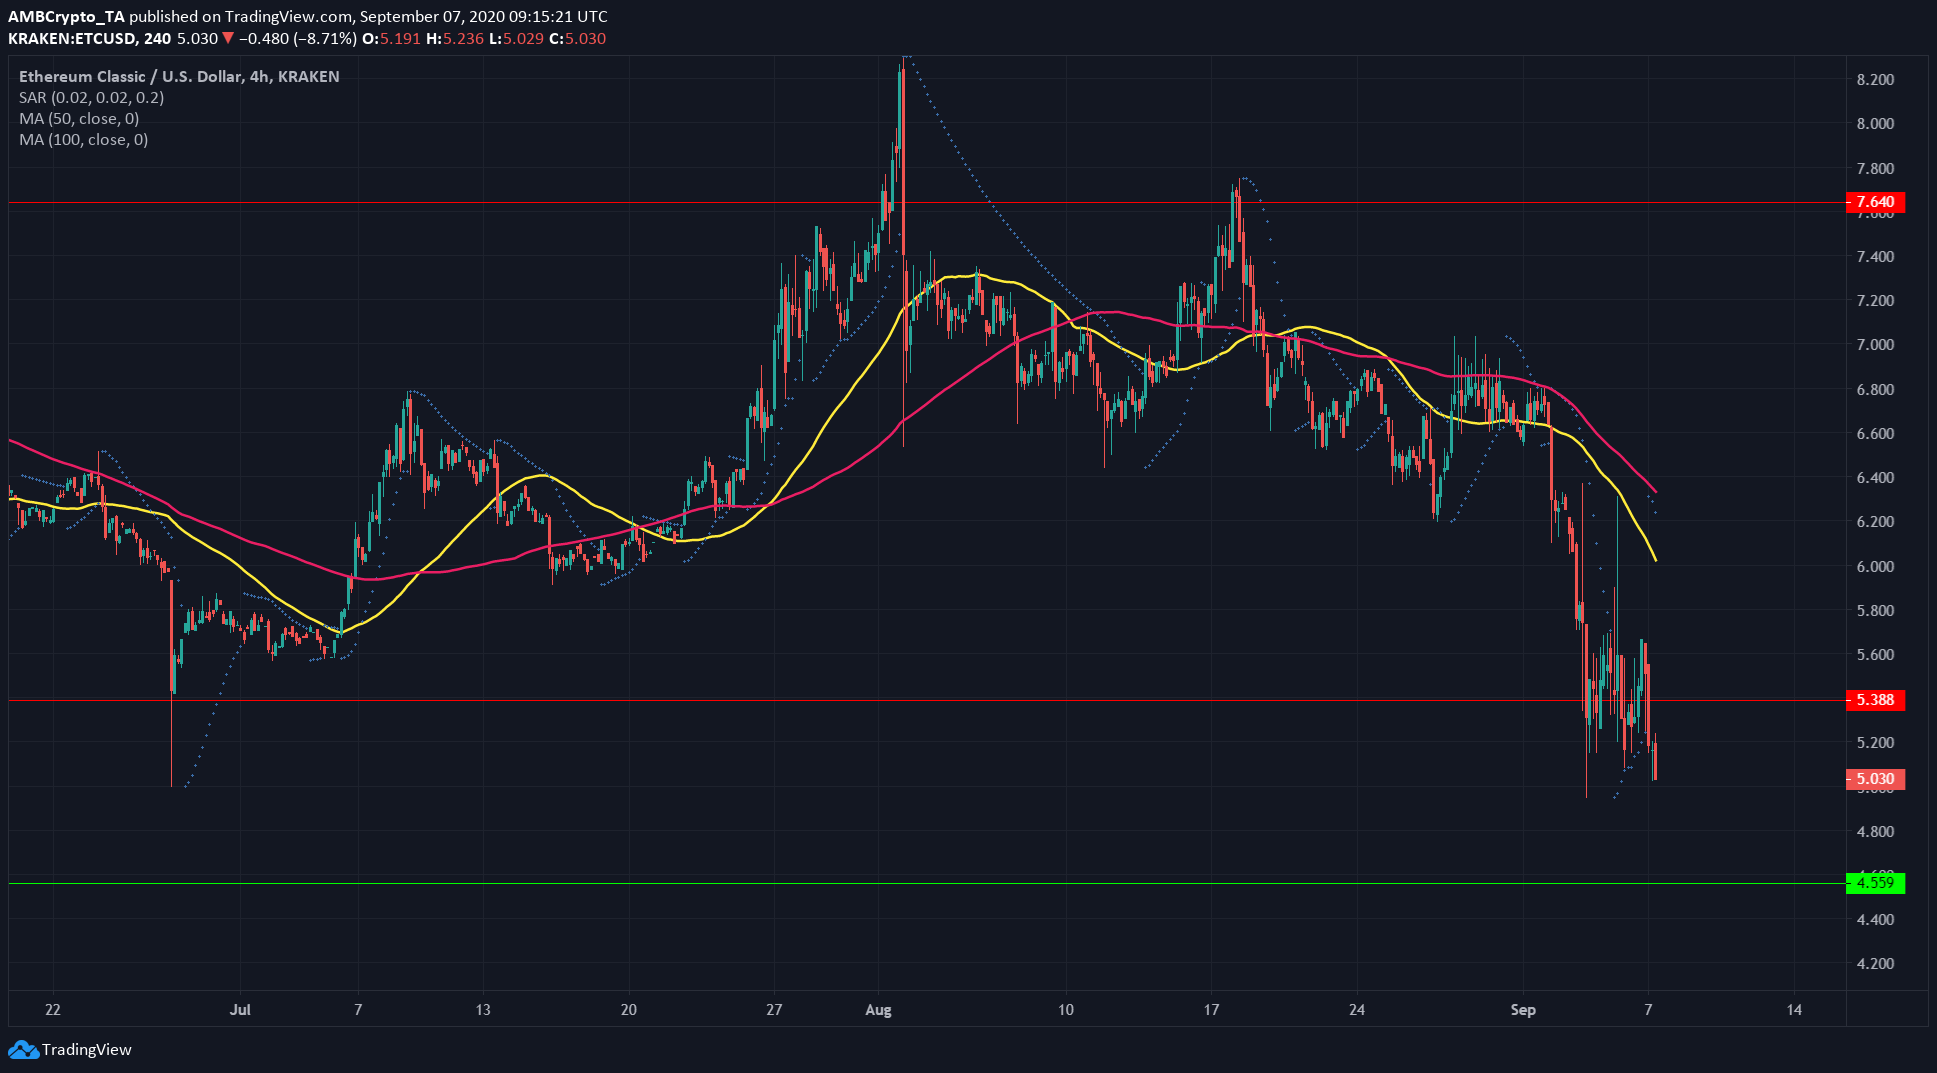
Ethereum Classic was trading beneath the significant level of $5.3, with ETC looking likely to slide down to $4.55.
The 50 SMA (yellow) had also crossed beneath the 100 SMA (pink) a few days ago, a development that underlined a shift toward bearishness.
The Parabolic SAR also gave a sell signal. The dotted markers of the indicator can be used as a stop loss by traders. In the case of ETC, the markers were above the 50 SMA on the charts.
ETC needs to reclaim the $5.3-level, as well as its moving averages, before it can be said to have reversed its trend.
Maker [MKR]

Source: MKR/USDT on TradingView
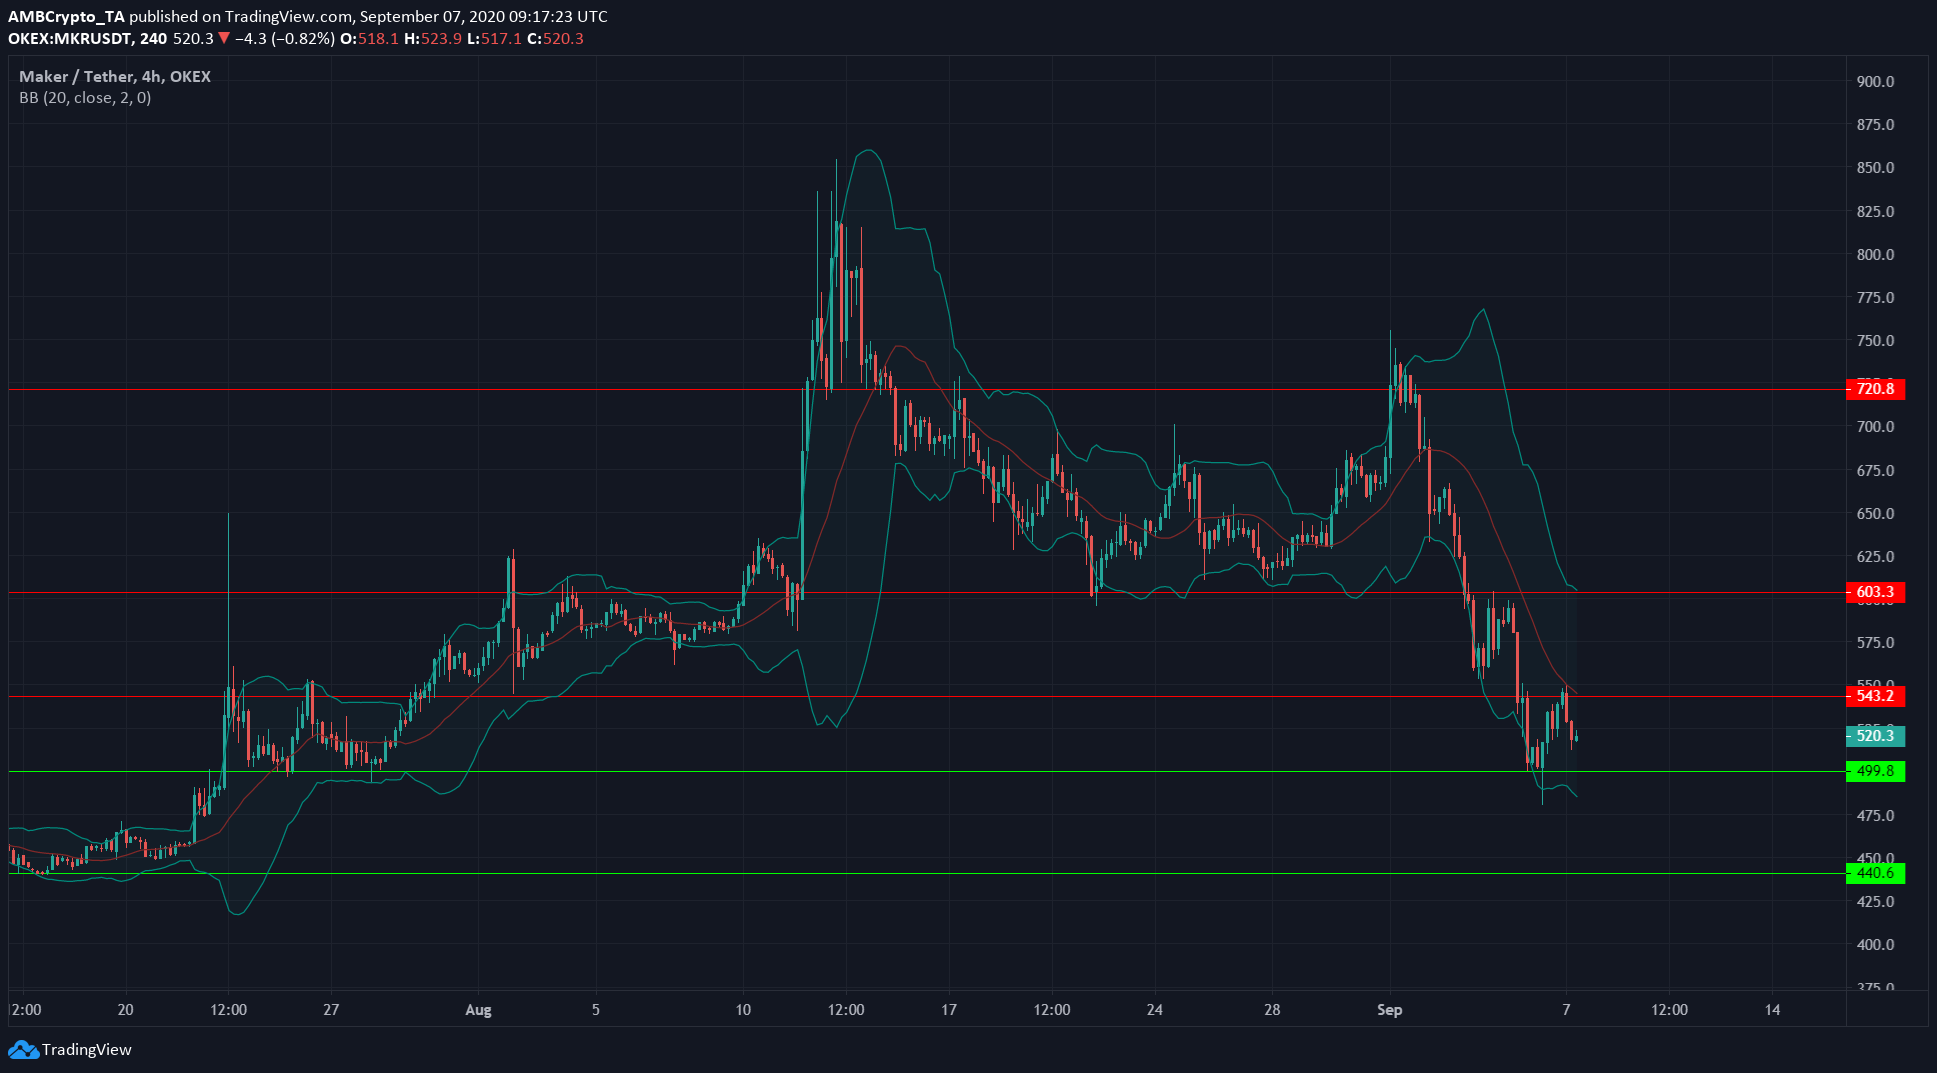
Maker tested its resistance level at $600, but was overwhelmed by sell pressure. MKR also bounced off the next level of support at $500, and the bounce took it all the way down to the resistance at $540.
MKR was valued at $520, at press time. A level of support lay around the $500-zone and MKR faced resistance at $543, a level where it had already been rejected in the past few sessions.
The Bollinger Bands‘ mouth showed no signs of tightening. MKR also failed to ascend past the 20-period moving average in the middle of the BB bands.
MKR was likely to lose support at $500 and move towards the next level of support at $440.


