Bitcoin

Did you buy the recent dip? Data suggest Bitcoin hodlers did
Posted:
| Last updated: February 14th, 2024

The last time Bitcoin was in the $3,000 range was in December 2018 until March 13, 2020, when it hit $3,850. Although 3,850 was a brief dip, many hodlers have started accumulation Bitcoin according to data.
Arcane Research’s latest report suggests the net hodler position was positive. The metric seen in the chart is called “Hodler Net Position Change” and it denotes the monthly position change of long-term investors.
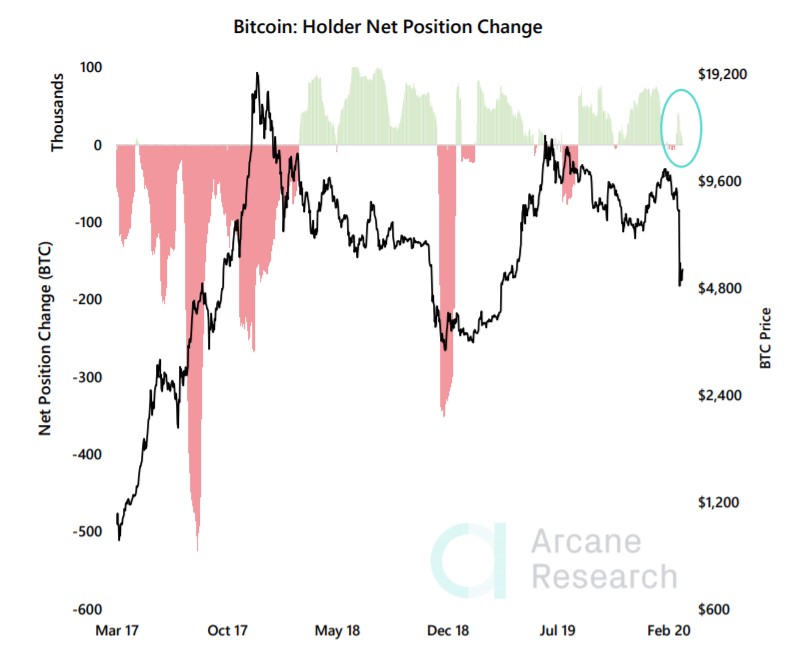
Source: Arcane Research
From the chart, it is clear that the metric has risen above the zero-line [average] which signifies hodling. Alternatively, if the metric is below the zero-line [red] it indicates hodlers selling their coins and taking profits.
Another metric that can be used to determine how important this dip is – SOPR. SOPR, also known as Spent Output Profit Ratio, is simply the ratio of price sold by the price paid and determines if the spent outputs are profitable or not.
This metric ranges above or below 1. If SOPR is greater than 1 that would imply the owners of the spent outputs are in profit at the time of the transaction, and usually during bull markets, SOPR values below 1 are rejected. Alternatively, during a bear market values of SOPR above 1 are rejected. This metric serves as a reliable marker for identifying local tops & bottoms.
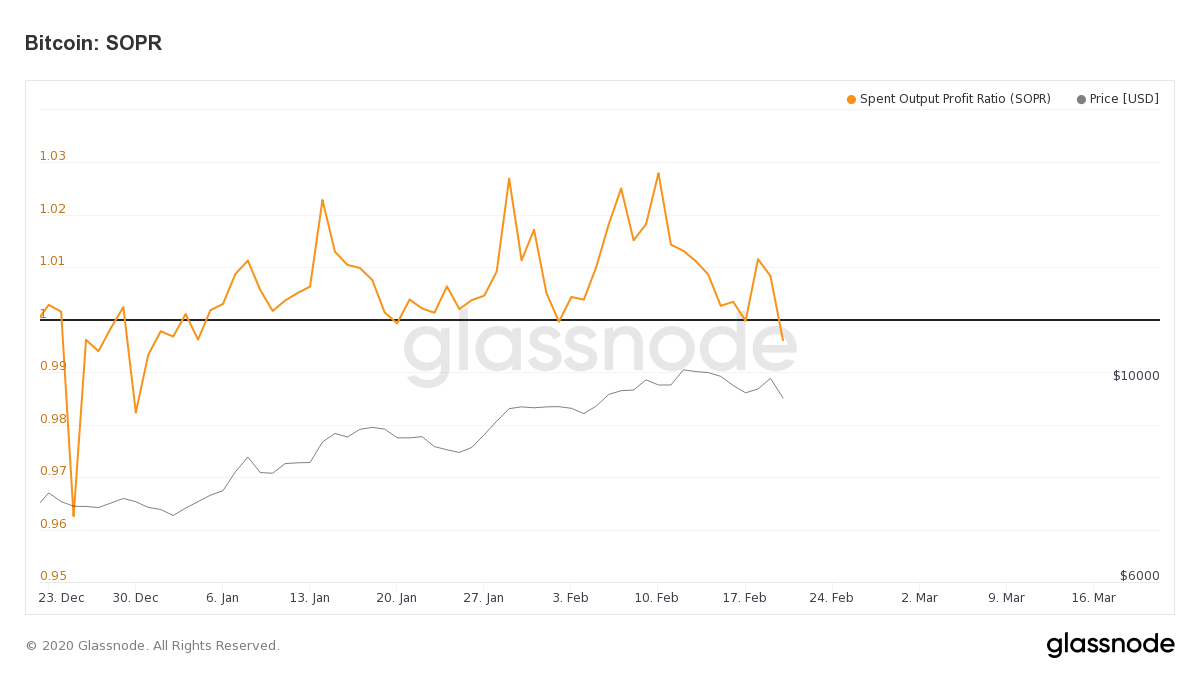
Source: Glassnode
For now, SOPR has fallen below 1 and the last time this happened was on December 30. 2019. This indicates that investors would be at a loss if they sold their Bitcoins now.
Miners
Bitcoin miners were the second most hit people in the Bitcoin ecosystem. Just before the crash the hash rate had hit a new high and so had the difficulty. However, with the recent sell-off on March 13, the cost of production of 1 Bitcoin was high in comparison to the price of Bitcoin. This caused the exodus of miners. The effect of this can be seen in the first spend chart, which indicates the movement of BTC out of the miner wallets.
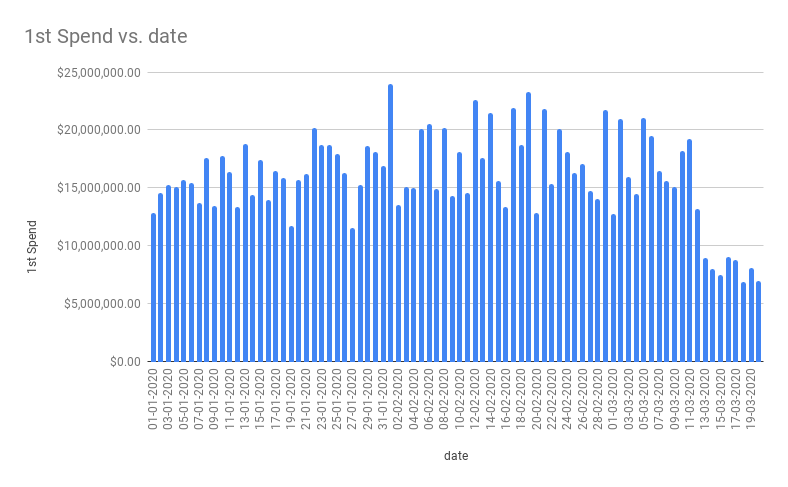
As seen, the first spend for miners has clearly decreased to a new low [$6.9 million] in 2020. The first spend along with the reduced SOPR indicates how this is the worst time to sell Bitcoins. In turn, this period is the best time to invest and hence the hodlers have bought Bitcoins, as indicated in the first chart, which has gone green [and above the average/zero-line].