Bitcoin

Bitcoin miners could cry capitulation yet again with price eyeing $7,600 level
Posted:
| Last updated: May 1st, 2024

The past week was brutal for Bitcoin, with the weekly candle coming to a close today. The weekly chart looked bearish with the current weekly candle engulfing 3 candles before it. As the price hovered steadily devoid of volatility, more scary drops seem to be approaching.
The article is broken down into 3 parts: the weekly chart, the daily chart [current scenario] and the daily chart [past price movement].
Bitcoin: Weekly

Source: BTC/USD TradingView
The weekly time frame, as mentioned before, showed a sudden 180-degree change in the price action. Millions were liquidated due to this outburst. 2017’s peak, the mid-2018’s rally and finally the surge in February 2020 were all the doings of a declining resistance [seen in the image above].
The price was also prevented from excessive collapse by the inclining support ranging from early March 2018 to mid-December 2019. As these lines converge toward each other, the price is left with less space to wiggle, resulting in a breakout.
What’s important here is the breakout direction, which depends on various factors. The farther we are away from the breakout point, the more chaotic the outcome will be.
For now, the price is holding still and the hash rate painted a different picture, an incoming bearish picture. The blue histogram in the hash ribbon indicator [seen in the chart above] represents the hash rate of Bitcoin. The smaller these histograms get, the close miners get to capitulation.
Last time this took place, the price went into the $6,400 range, which led to the development of red histograms. With the fear of COVID spreading over to global markets, a less optimistic sentiment holds true for many assets.
With miners in China shutting down farms due to the virus and considering that the majority of Bitcoin’s hash rate comes from China, an effect on the hash rate is probable.
The Daily Chart – Present

Source: BTC/USD TradingView
Declining hash rate and the price together have wreaked havoc on the whole of the cryptocurrency ecosystem. If this continues, the important levels to lookout include $8,212, $7,667, $6,853, and $6,475.
Although price hitting $6,400 is unlikely, one should prepare for it.
Furthermore, the Fibonacci tool stretching from Mid-December lows to mid-February highs, show important levels to keep an eye out for. Currently, the price is just above $8,461 support level, which also happens to be the 0.5-Fibonacci level. More often than not, this is a crucial level and breaching this has yielded in a sharp verticle decline.
Examples of these are illustrated with examples in the section below.
The Daily Chart – Past

Source: BTC/USD TradingView
Take, for example, the recent surge to $13,800, this was eerily similar to the drop witnessed after the 2017 surge. However, the steep drop [circled in purple] took pace after the price broke the 0.5-Fibonacci level. It should be noted here that past performances do not indicate or predict future price actions.
However, should the same drop occur, the price could easily hit $8,212 or slip down a single wick to $7,667.
Bitcoin miners’ and their state
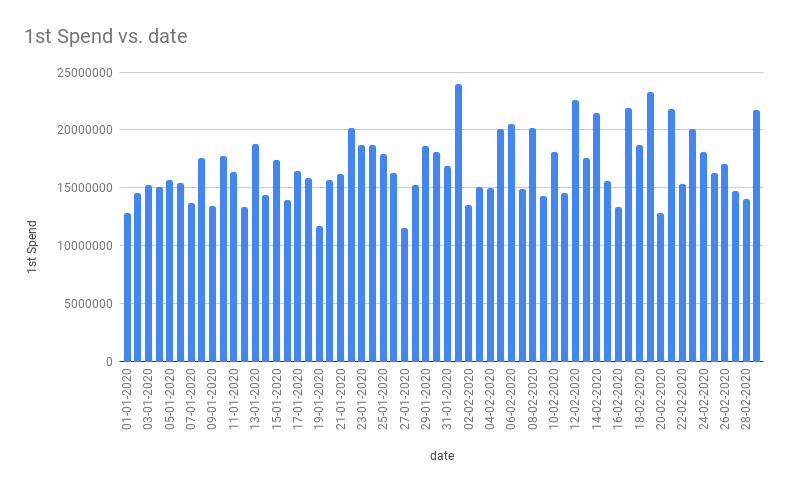
Source: ByteTree
First spend is a metric that tracks the number of coins that move from the miners’ wallets over that period. This metric usually skyrockets during capitulation. The last time this happened in Dember 2018, Bitcoin was under its fair price and dipping lower.
This metric has started to surge in 2020.
Closing Thoughts
The breach below the 0.5-Fib level [$8,461] would be devastating. Although this would seem like an unlikely scenario, it should be noted that the BTC is stuck between the two trendlines since 2017. Since the price has struck the top end of this structure, it is only safe to assume that the price will hit or at least travel near the other end. The price level at this point would be $7,667.
This would call for miners’ capitulation cry as witnessed in late-2019.
As for the breakout from this pattern, it is too soon to tell. However, as price nears the pattern’s apex, depending on the conditions at that point in time, the direction of the breakout can be estimated.
For now, it is better to wait for the volatility to show than be stuck in swing trades or short term trades that go against you.


![Real-world assets [RWA]: How to invest in Gold & Real Estate on-chain](https://eng.ambcrypto.com/wp-content/uploads/2026/02/Samyukhtha-5-400x240.webp)