
As of November 17, 2019, trading volumes across major exchanges dropped to a 3-month low and it looks like it is going to continue dropping. Is it the calm before the storm? If yes, what could be in store – surge or a drop?
The interesting observation is that the trading volume started its decline on November 15 and rapidly declined to the current lows. For Coinbase, the poster child for crypto exchanges in the U.S., the volume declined from $185 million to $65 million. For Binance, the decline occurred from $1 billion to $517 million.
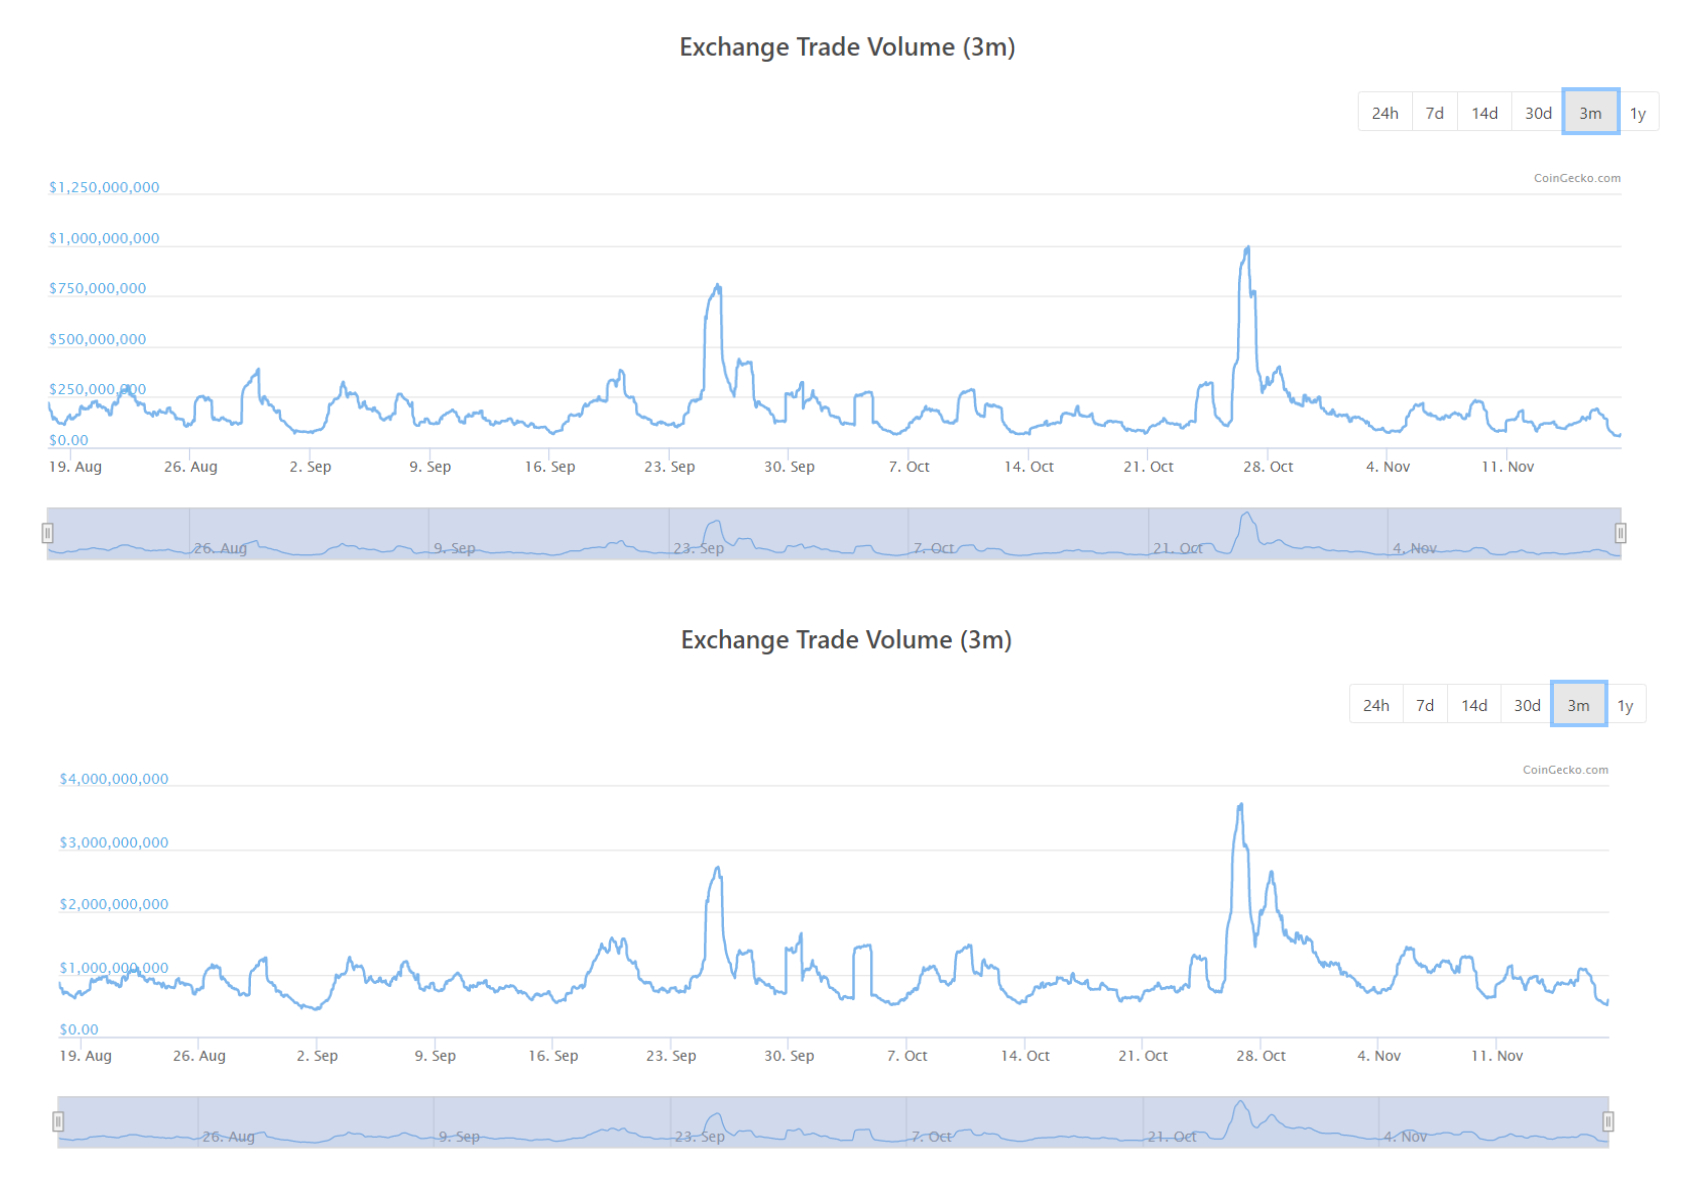
Coinbase Vs. Binance Source: CoinGecko
For Bitfinex, the trading volume dropped from $96 million to $39 million, whereas, BitMEX’s trading volume dipped from $2.9 billion to $905 million, a whopping 68% decline in BitMEX’s trading volume,
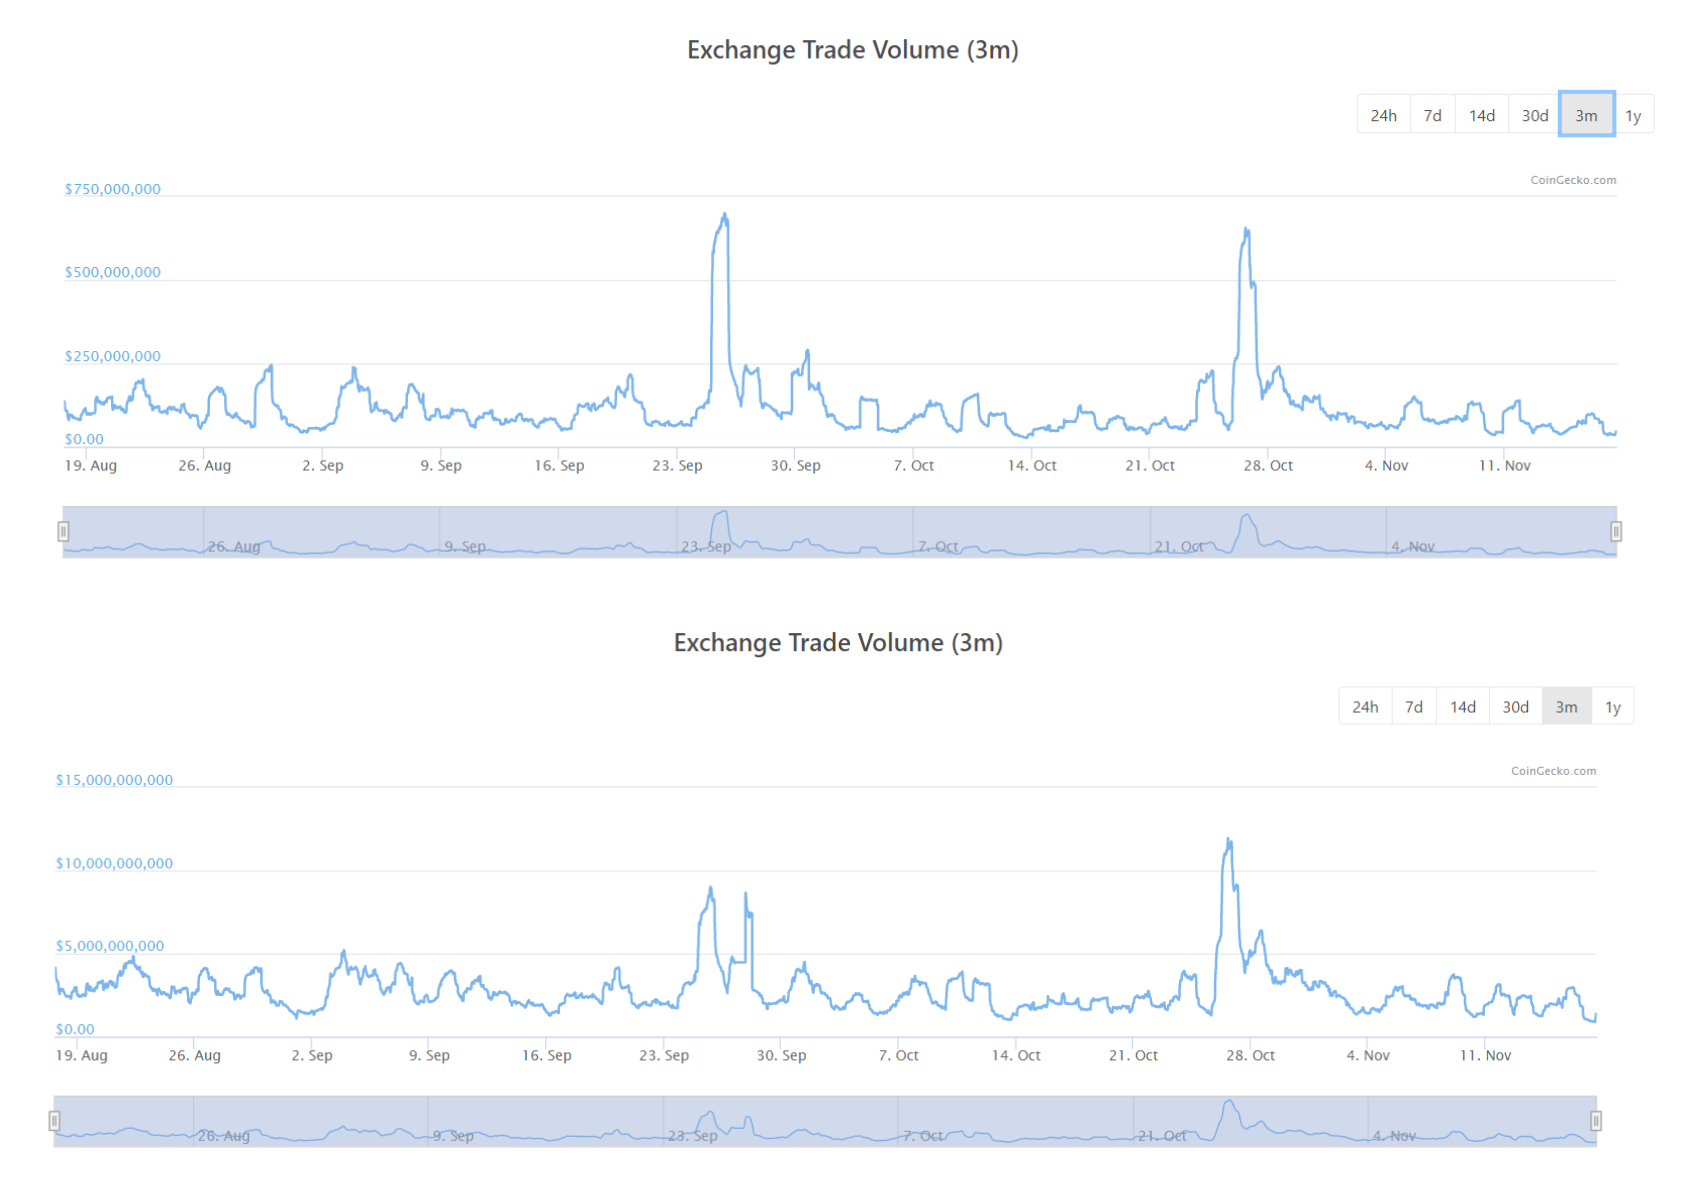
Bitfinex Vs. BitMEX Source: CoinGecko
For all of the above charts, it is clear that the drop is the lowest seen in the last three months. The most brutal drop was seen with BitMEX which saw a 68% decline in trading volume. Following it was Coinbase with a 64% decline, Bitfinex at 59% and the least affected exchange among the lot was Binance with a decline of 48%.
A Look into Volatility
The volatility of Bitcoin hit a low of 2.5% on October 25 which was seen with a reaction from Bitcoin’s price which rose from $7,400 to $10,000 in a single daily candle. Since then, the volatility has plateaued near the 4% point for over 20 days.
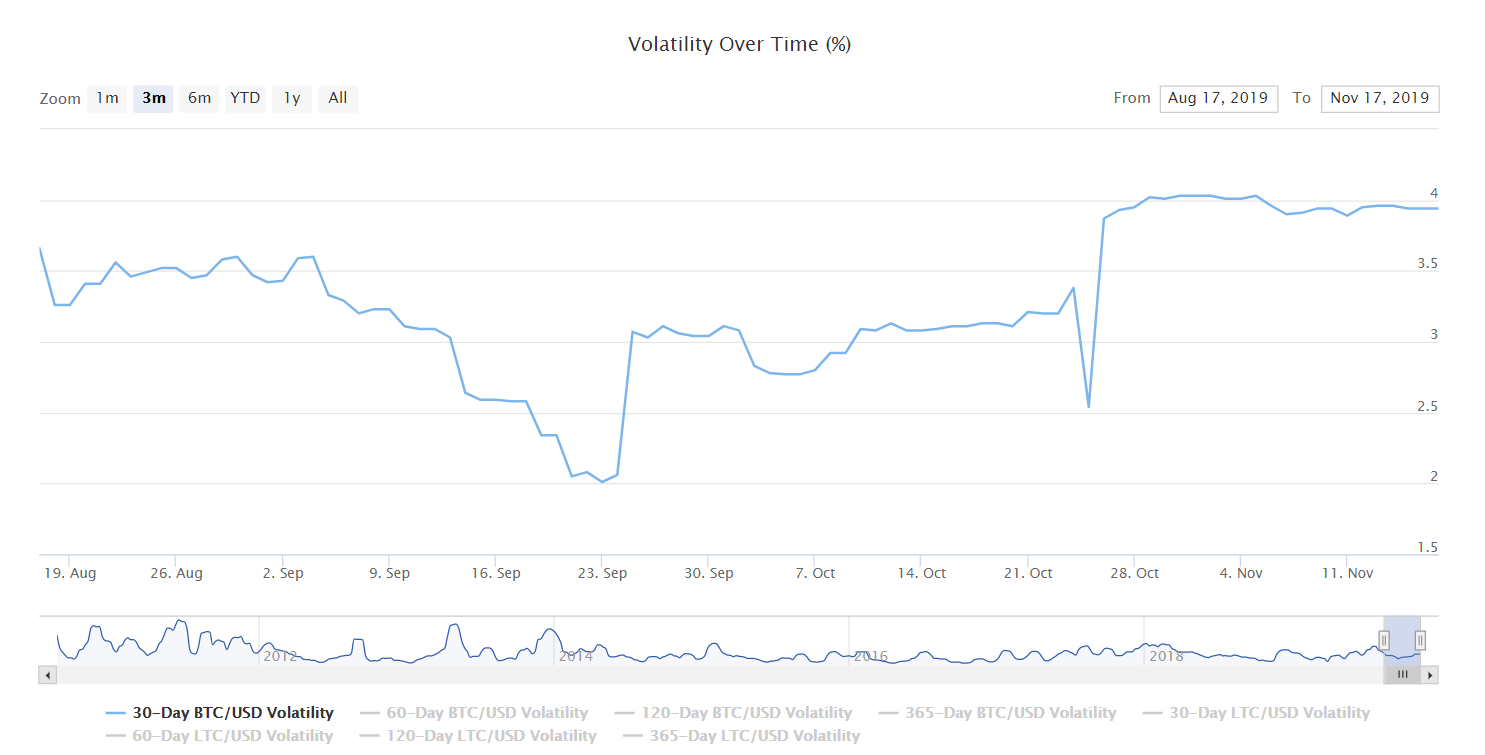
Source: BitVol
The last time volatility moved sideways was after the April-pump when Bitcoin went from $4,100 to $5,600 in 30 days. Following this, the volatility dropped giving rise to more price surges. At present, the volatility looks like it will do something similar, causing a massive price movement. However, the direction in which BTC will move is still unknown.
However, looking at the price chart of Bitcoin, the price keeps forming lower lows on the daily time frame. The price is stuck inside a falling wedge pattern indicating a pump when it breaks out of the pattern. Moreover, the price has also tested the 0.786-Fibonacci level [$8,370] and seems to be supported by it. Disagreeing with the above is the Death Cross which has been clobbering the price and preventing bulls from taking control. This gives a 50-50 chance, meaning BTC could break out either way. However, one thing is sure, the breakout will be volatility induced move much like the one seen on October 25.